The United States and much of the world may have initiated a business shutdown—resulting in tens of millions of unemployed domestically, along with all of unemployment’s other negative side effects—for no statistically measurable benefit in tamping down COVID-19. (See Figure 1 )
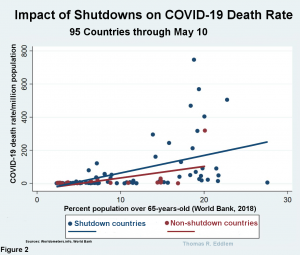
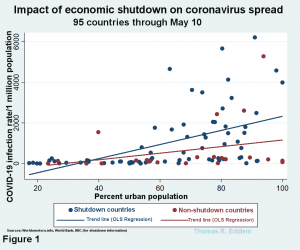 A multivariate analysis of the 95 countries which had their first COVID-19 infection on or before March 15 and whether they had a “non-essential business” shutdown before April 7 yields a smaller infection rate coefficient for non-shutdown countries even after controlling for variables such as population density, percent of urban population, income levels and Asia-Pacific cultural differences (which includes higher proportional mask-wearing). Nor is there a statistically significant increase in death rate from COVID-19 among non-shutdown countries, though many nations with large elderly populations did experience higher death rates. (See Figure 2)
 While non-shutdown countries actually had lower infection rates, the study did not find that this difference was statistically significant (See Tables 1, 2 and 3 in the data discussion portion of this article below).
Much of the world panicked under inaccurate near-doomsday scenario theoretical models, shutting down businesses deemed “non-essential” in March and early April. But several dozen countries took the different path of engaging in social distancing and canceling large venues but leaving most businesses to operate with more modest restrictions.
The modeling scenarios predicting millions of deaths in the U.S. were predicated upon the unrealistic expectation that Americans would stupidly act socially precisely as they had before the virus, as if COVID-19 was no threat. However, even before regional shutdowns were imposed across the United States in the middle of March, large venues such as the NBA had canceled events, and Americans had begun mask-wearing even as officials such as CDC official Dr. Anthony Fauci and the World Health Organization were still counseling Americans not to wear masks when venturing out in public.
In short, the American public led the state and federal government response to the virus, providing an example of how decentralized individual responsibility make the country safe while government officials are still oblivious and providing bad advice in order to hoard masks.
With several months of data, it’s now possible to scientifically measure the results of the shutdowns. Since we now possess real-world data on the impact of the shutdowns, there’s no excuse to fall back on theoretical models or the patchwork historical Spanish Flu data from 1918 to run a study of the impact of business shutdowns. There’s never a scientific reason to dismiss the factual for the counter-factual. Indeed, to fall back on the old theoretical models at this point would be statistical malpractice: good scientists never discard actual results for a failed theoretical model or a tangential issue.
Of the six variables analyzed in the global data, only “percent urban population” and “advanced economy” registered as statistically significant (a 95% confidence that there is a positive affect). Both of these may be related, as the virus is transmitted primarily through human contact. Urban populations tend to have more personal interactions, and advanced economies are more likely to travel internationally. In general, advanced economies received their first infection earlier than lesser developed countries.
This study also attempted to isolate mask-wearing culture in the Asia-Pacific variable, and although Asia-Pacific nations tended to have lower infection coefficients, the differences were not found to be statistically significant.
An analysis of the 50 U.S. states and the District of Columbia, three of which didn’t engage in a business shutdown (Nebraska, South Dakota and Wyoming), yielded a negative coefficient on a two-variable analysis (Tables 4) but a five-variable analysis yielded a positive infection coefficient for states that didn’t shut down (Tables 5 and 6). But like the global data the business shutdown, neither was statistically significant with regard to infection rates.
Data Discussion: Methodology, Sources, and Tables
The goal of this paper is to study whether the shelter-in-place orders in the early months of the break out of COVID-19 in the United States saved lives in comparison with established scholarly research that opioid deaths increase by 0.19 per 100,000 population in the U.S. with a one percent increase in the unemployment rate. This amounts to 629 additional opioid deaths per year, per one percent increase in the unemployment rate in the United States.
This study measured only the marginal impact of “stay-at-home” orders and closure of “non-essential” businesses at the global, national, and U.S. state levels, not the impact of closure of schools, social distancing practices, prevalence of mask-wearing or mandatory closure of large venues such as sporting events, worship services, and concerts. The latter have largely been universal, and these latter restrictions clearly will also result in substantial long-term unemployment. The former—encompassing three U.S. states and at least 23 foreign countries—are also believed to be responsible for substantial unemployment, including substantial long-term employment.
In measuring which countries are “shutdown” countries and which are not, the following criteria were used:
Only countries that had their first COVID-19 infection before March 15 were considered in this study, countries with their first infection after that time were discarded in order to have approximately 8 weeks of infection data to measure (i.e., the beginning of the outbreak when—presumably—there was little time to accommodate scarce hospital beds and ventilators for the infected in the breakout).
“Shutdown” countries are nations (or states) that imposed national or regional closure of what were deemed “non-essential” businesses on or before April 7, according to a metric published by the BBC on April 7 (and hand-collected data by the author for U.S. states). Three nations had imposed shutdowns (including China) early in the outbreak but lifted them well before April 7, and they therefore count as “non-shutdown” nations. The lone exception to this rule of following the BBC story list is Singapore, which was listed as a non-shutdown nation on the BBC story, but imposed its first shutdown on April 7, just too late for the BBC press deadline, so it is included as a shutdown nation. The idea behind using April 7 as a metric was that the BBC provided a handy guide, and it would give more than a month of data on the spreading of the virus after a shutdown had been imposed.
The hypothesis to be tested is the following: “The economic shutdowns in the United States saved lives because they prevented at least an additional 627 COVID-19 deaths in the US with a 95% confidence level.” This hypothesis was rejected, though it is still statistically possible that the shutdowns did have a small positive impact in the infection rate. Note: The working assumption for this study is that the purpose of the shutdown is not to stamp out the disease, but to prevent a spike in deaths related to hospital capacity—i.e., the assumption that the number of infections (as opposed to deaths) will be the same whether the curve is a spike or a long, flat curve unless it involves over-capacity hospitals. Moreover, it is presumed that the closure of non-essential businesses will contribute to at least a one percent increase in the unemployment rate for at least one year.
Regarding hospital capacity, the United States had a relatively high level of capability compared with the nations of the world, leading the world in per capita intensive care beds. Moreover, because hospital ICU capacity was generally at 60% before the COVID-19 crisis, health care experts suggested that “if the infection rate is only 20 percent (low end of current estimates), we would largely be able to meet the needs for inpatient care if we flatten the curve to 12 months.” None of these capacities were exceeded in the actual infection, nor are any of them expected to be exceeded without a shutdown.
Country and state data was gathered from Worldometers.info and matched to a list of shutdown/no-shutdown nations published by the BBC April 7. 95 nations for which COVID data and shutdown information met the criteria, including 72 that had shutdown orders by April 7 and 23 nations that did not. Other information regarding percent of urban population or population density were gathered from the World Bank or the U.S. Census Bureau (2010). The “advanced economy” dummy variable was manually created by the author using the International Monetary Fund’s list of “advanced economies,” and the Asia-Pacific dummy variable was created by the author for nations on the Asia-Pacific rim or in Southeastern Asia.
All of the statistical regressions used for this study were run on Stata (version 16), and the graphs were generated using that software program (though the labels were enhanced using a graphics program). The working spreadsheets used for this study can be found here (world) and here (states/DC). The Stata commands used to generate the results can be found here.
Table 1. World data through May 20 – 2 variables
| TotCases/MilPop | Coef. | St.Err. | t-value | p-value | [95% Conf | Interval] | Sig | |||
| No national or regional shutdown order | -412.231 | 312.202 | -1.32 | 0.190 | -1032.202 | 207.740 | ||||
| Constant | 1041.014 | 176.066 | 5.91 | 0.000 | 691.381 | 1390.647 | *** | |||
| Mean dependent var | 941.211 | SD dependent var | 1439.202 | |||||||
| R-squared | 0.015 | Number of obs | 95.000 | |||||||
| F-test | 1.743 | Prob > F | 0.190 | |||||||
| Akaike crit. (AIC) | 1652.787 | Bayesian crit. (BIC) | 1657.895 | |||||||
| *** p<0.01, ** p<0.05, * p<0.1 | ||||||||||
Table 2. World data through May 20 – 6 variables
| TotCases/MilPop | Coef. | St.Err. | t-value | p-value | [95% Conf | Interval] | Sig | |||
| No national or regional shutdown order | -245.001 | 280.258 | -0.87 | 0.384 | -801.869 | 311.866 | ||||
| Advanced economy (IMF) | 1618.017 | 370.701 | 4.37 | 0.000 | 881.44 | 2354.591 | *** | |||
| Asia-Pacific | -102.237 | 69.230 | -1.48 | 0.143 | -239.795 | 35.321 | ||||
| Percent urban population (World Bank 2018) | 12.153 | 4.313 | 2.82 | 0.006 | 3.583 | 20.723 | *** | |||
| Population density (people/sq. kilometer) | -0.085 | 0.048 | -1.78 | 0.078 | -0.180 | 0.010 | * | |||
| Constant | -217.357 | 221.373 | -0.98 | 0.329 | -657.221 | 222.506 | ||||
| Mean dependent var | 941.211 | SD dependent var | 1439.202 | |||||||
| R-squared | 0.423 | Number of obs | 95.000 | |||||||
| F-test | 7.888 | Prob > F | 0.000 | |||||||
| Akaike crit. (AIC) | 1610.042 | Bayesian crit. (BIC) | 1625.365 | |||||||
| *** p<0.01, ** p<0.05, * p<0.1 | ||||||||||
Table 3. World data through May 20 – Side-by-side table – 6 variable regression
| (1) | (2) | (3) | (4) | (5) | |
| TotCases/MilPop | TotCases/MilPop | TotCases/MilPop | TotCases/MilPop | TotCases/MilPop | |
| No national or regional shutdown order | -412.2 | -543.3 | -492.6 | -242.6 | -245.0 |
| (-1.32) | (-1.81) | (-1.61) | (-0.86) | (-0.87) | |
| Percent urban population (World Bank 2018) | 29.93*** | 31.04*** | 12.28** | 12.15** | |
| (5.05) | (5.06) | (2.85) | (2.82) | ||
| Population density (people/sq. kilometer – World Bank) | -0.0484 | -0.0916 | -0.0850 | ||
| (-0.99) | (-1.95) | (-1.78) | |||
| Advanced economy (IMF) | 1631.8*** | 1618.0*** | |||
| (4.40) | (4.36) | ||||
| Asia-Pacific | -102.2 | ||||
| (-1.48) | |||||
| _cons | 1041.0*** | -844.7** | -903.0** | -254.0 | -217.4 |
| (5.91) | (-2.85) | (-2.98) | (-1.16) | (-0.98) | |
| N | 95 | 95 | 95 | 95 | 95 |
| t statistics in parentheses | |||||
| =”* p<0.05 | ** p<0.01 | *** p<0.001″ | |||
Table 4. US States and DC Two-variable linear regression
| TotCases/MilPop | Coef. | St.Err. | t-value | p-value | [95% Conf | Interval] | Sig | |||
| No statewide shutdown order | -507.375 | 984.315 | -0.52 | 0.609 | -2485.430 | 1470.680 | ||||
| Constant | 3580.708 | 549.649 | 6.51 | 0.000 | 2476.147 | 4685.270 | *** | |||
| Mean dependent var | 3550.863 | SD dependent var | 3674.961 | |||||||
| R-squared | 0.001 | Number of obs | 51.000 | |||||||
| F-test | 0.266 | Prob > F | 0.609 | |||||||
| Akaike crit. (AIC) | 985.015 | Bayesian crit. (BIC) | 988.879 | |||||||
| *** p<0.01, ** p<0.05, * p<0.1 | ||||||||||
Table 5. US States and DC through May 27 – 5 variable linear regression
| TotCases/MilPop | Coef. | St.Err. | t-value | p-value | [95% Conf | Interval] | Sig | |||
| No statewide shutdown order | 670.906 | 918.241 | 0.73 | 0.469 | -1176.357 | 2518.170 | ||||
| Population density people/sq. kilometer (2010 US Census) | 0.454 | 0.238 | 1.91 | 0.063 | -0.025 | 0.934 | * | |||
| Percent urban population (2010 census) | 10260.014 | 3672.727 | 2.79 | 0.008 | 2871.439 | 17648.589 | *** | |||
| Constant | -4259.323 | 2318.506 | -1.84 | 0.073 | -8923.556 | 404.910 | * | |||
| Mean dependent var | 3550.863 | SD dependent var | 3674.961 | |||||||
| R-squared | 0.246 | Number of obs | 51.000 | |||||||
| F-test | 6.555 | Prob > F | 0.001 | |||||||
| Akaike crit. (AIC) | 974.670 | Bayesian crit. (BIC) | 982.397 | |||||||
| *** p<0.01, ** p<0.05, * p<0.1 | ||||||||||
Table 6. US States and DC through May 27 – side-by-side table
| (1) | (2) | (3) | (4) | |
| TotCases/MilPop | TotCases/MilPop | TotCases/MilPop | TotCases/MilPop | |
| No statewide shutdown order | -507.4 | -211.6 | 670.9 | 996.6 |
| (-0.52) | (-0.22) | (0.73) | (1.21) | |
| Population density persons per sq. kilometer | 0.784** | 0.454 | 0.304 | |
| (2.77) | (1.91) | (1.55) | ||
| Percent Urban population (2010 US Census) | 10260.0** | 7781.4* | ||
| (2.79) | (2.62) | |||
| Tests/Mil pop | 0.140** | |||
| (3.31) | ||||
| _cons | 3580.7*** | 3273.8*** | -4259.3 | -6357.6** |
| (6.51) | (6.33) | (-1.84) | (-2.80) | |
| N | 51 | 51 | 51 | 51 |
| t statistics in parentheses =”* p<0.05 ** p<0.01 *** p<0.001″ | ||||
For multicollinearity
Table 7. Variance inflation factor check for world data
| VIF | 1/VIF | |
| Advanced economy (IMF) | 1.552 | .644 |
| Percent urban population (World Bank 2018) | 1.529 | .654 |
| Population density (people/sq. Kilometer – World Bank) | 1.148 | .871 |
| No national or regional shutdown order | 1.078 | .928 |
| Asia-Pacific | 1.02 | .98 |
| Mean VIF | 1.266 | . |
Table 8. Variance inflation factor check for 50 states and DC
| VIF | 1/VIF | |
| Percent urban population (2010 centus) | 1.178 | .849 |
| Population density persons per sq. kilometer | 1.127 | .888 |
| Tests per 1 million population | 1.077 | .928 |
| No statewide shutdown order | 1.027 | .974 |
| Mean VIF | 1.102 | . |