You can count on the knuckleheads at Bloomberg to start off the year with still another dead-wrong proposition. That is, more nonsense about the “strong” labor market—-one so strong that it is purportedly even defying the mighty Fed.
The latest US employment report is anticipated to highlight the resilience of the nation’s labor market through 2022, despite the most aggressive pace of monetary tightening in decades.
Really?
The chart below is supposed to a show a booming +392,000 new jobs per month during the first 11 months of 2022, but it neglects to mention the starting point: Namely, that the nonfarm payroll count in December 2021 was 149.24 million, thereby representing a cumulative -3.264 million job loss from the pre-COVID starting point of February 2020.
Stated differently, upwards of 76% of the job gains represented by the blue bars were “born again jobs”, originally lost owing to the Lockdowns and COVID-Hysteria of 2020-2021. It wasn’t until August 2022 that the job count of February 2020 (152.504 million) was finally regained.

So what an honest rendition of the blue bars above would actually show is that during the 33 months since February 2020, the average NFP gain has been only 32,000 per month—a figure just 8% of that implied by the Bloomberg chart above.
For want of doubt, consider the similar 33 month period prior to the pre-recession peak in December 2007. During that expansion interval before the bottom dropped out, the number of new NFP jobs had averaged 159,000 per month or 5X more!
And that was in the context of a significantly smaller economy and work force. Therefore in terms of the jobs growth rate on a standardized basis, between March 2005 and the December 2007 cyclical peak the NFP growth rate was 1.42% per annum or nearly 6X the mere 0.25% per annum gain since February 2020.
Still, the far more robust pre-recession growth rate shown in the left panel of the chart below did not forestall the Great Recession, nor did the 5.26 million jobs gained during that period make-up for the plunge which followed.
In fact, the jobs loss between December 2007 and the February 2010 bottom totaled -8.65 million or 65% more than the gain during the 33-month run-up to the start of the 2008-2009 recession.
To be sure, solid analysts have long recognized that jobs are a lagging indicator and that what’s in the immediate rear-view mirror may be more noise than signal—especially at cyclical turning points. Apparently, however, the Wall Street/Washington upbeat narrative must go on—and does go on because MSM journalists have gotten too servile and too lazy to notice the difference.
Nonfarm Jobs Change Per Month, 2005-2010

Of course, Bloomberg is not alone in pumping the “strong” economy narrative. Today’s Wall Street Journal would have you believe that the almighty American consumer has already leapt from the chasm triggered by the Lockdowns in 2020 and is now back on tracking, spending like always.
Of course, what goes unmentioned in the chart below is the means by which real household PCE got back to trend (blue line). That is, they didn’t “earn” their way there; they borrowed their way back.

As a result, the personal savings rate has plummeted from 8.3% of disposable personal income on the eve of the COVID crisis to just 2.4% in November 2022. That’s the lowest rate recorded in the last 63 years!
So, yes, households have reverted to spending up a storm. But its based on borrowed money, depletion of their rainy funds and swelling transfer payments to be funded by future taxpayers. “Strong” is not exactly an apt description of such unsustainable expedients.
Personal Savings Rate, 2020 to 2022

At the end of the day, households can only spend what they have first produced. So the real measure of sustainable economic strength is the growth rate of real personal income excluding transfer payments. That latter figure eliminates from the statistic for aggregate national income both inflation and the free stuff transferred by the state from the work of others.
As shown by the purple line below, this measure of real output has been essentially flat since February 2020, rising by just 1.3% compared to a 7.4% gain in real PCE (brown line). Accordingly, upwards of 82% of the gain in real PCE ballyhooed by the WSJ above did not arise from actual gains in aggregate production and income.
Indeed, the recent growth rate of real personal income less transfer payments has been downright paltry by historical standards. The gain of just 0.46% per annum embodied in the purple line below compared to an average growth rate of 3.54% per annum between 1959 and 2001.
Needless to say, a growth rate of just 13% of its long-term average is nothing to write home about, except to convey a dire warning that something is fundamentally rotten in Denmark with respect to the U.S. economy as we enter 2023.
Change Since February 2020: Real Personal Income Excluding Transfer Payments Versus Real PCE

The rotten part is otherwise known as net investment. The $841 billion level (2009 $) posted during 2021 was actually 10% below its year 2000 level.
That is to say, when we strip out inflation and the portion of the capital stock consumed in production during the current year (i.e. depreciation and amortization) from the national investment accounts we get two decades of weakness, not a booming economy per the current mainstream narrative.
After all, if real net investment is negative on a persistent basis, where does future productivity and capacity growth actually come from?
Real Net Private Investment, 2000-2021

At the same time, inflation keeps eating away at what nominal growth is actually occurring. During the past few months the 16% trimmed mean CPI, which strains out the short-run volatility in the index, rose at north of 7% per annum, its highest rate of gain in history.
So the notion that the Fed is nearly done with its anti-inflation campaign is just wishful thinking. The price/wage/cost dynamic has now penetrated to the full interior of the the index, meaning that this key measure of trend-inflation will not be dropping below 5% for many months to come.
Y/Y Change In 16% Trimmed Mean CPI, 1985-2022

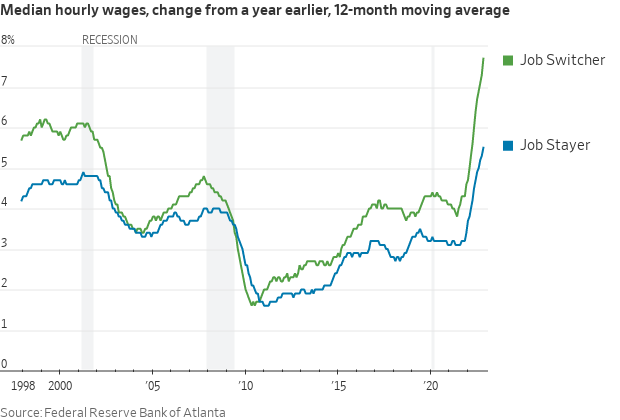
For want of doubt, consider the special wage indices published by the Atlanta Fed, which break-out the rate of gain as between workers who remain in the same job versus those who switch, presumably for better compensation.
For the year ending in November, the 5.5% gain for workers who stayed at their jobs was bad enough. It was up from 3.7% annual growth in January 2022 and the highest increase in 25 years of record-keeping.
But the real signal comes from the wage gain for employees who changed jobs, thereby representing the marginal wage trend of the U.S. economy. Employees who changed companies, job duties or occupations saw even greater wage gains of 7.7% in November from a year earlier.
Needless to say, these gains will soon manifest themselves in rising pricing, even if the economy does sink into recession. Except it will then be called “stagflation” causing the Fed’s worst fear to become a stubborn reality during the year ahead.
In the context of continued Fed tightening and a disappointing “stickiness” in the inflation rate, bonds are heading for another round of losses. That comes on top of the fact that the normally safe U.S. bonds delivered losses over the past 12 months that far exceeded anything investors have seen in their careers.
The Bloomberg U.S. Aggregate bond index dropped 13% last year, easily outdoing its previous worst year in data going back to the 1970s, when it declined 2.9% in 1994.
So, yes, the Great Money Bubble, is coming to a crushing halt. The putative signs of “strength” ballyhooed by the MSM are nothing of the kind.
This article was originally featured at David Stockman’s Contra Corner and is republished with permission.