As President Joe Biden’s tax policy discussions start heating up, some familiar lies have made their way back into the political parlance. There are four specific lies upon which I’ll focus here:
- The rich need to pay their “fair share”
- The Trump tax cuts only went to the wealthiest Americans
- Nobody making less than $400k will see their taxes increase under the Biden plan
- The wealthy pay less taxes than their secretaries
Progressives generally classify the “rich” as the top 1%, those evil “millionaires and billionaires,” as Senator Bernie Sanders used to say (until he became a millionaire; now he just says the “billionaires”). Even a cursory scan of IRS tax data shows the 1% has been paying more than their share for decades. For the record, from 1913 until about 1940, the top 2% of income earners in the United States paid 100% of the federal income tax burden. This means their “fair share” was all of it.
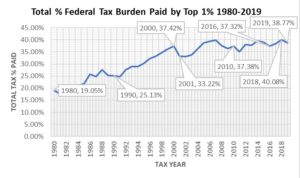
Source: IRS, Statistics of Income, Individual Income Rates and Tax Shares
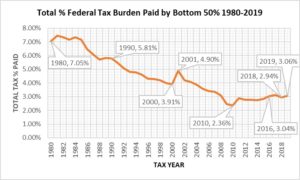
Now let’s compare the top 1% burden to the bottom 50%.
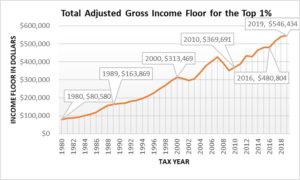
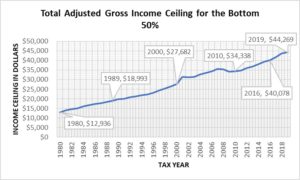
What does top 1% and bottom 50% really mean? Many people don’t understand the rhetoric, but nod their heads in agreement anyway. If the IRS receives 100 million tax returns, then top 1% means one million of those returns had adjusted gross incomes (AGI) above a set dollar amount while bottom 50% means there were 50 million returns below a specific AGI. These numbers change every year. More importantly, what is the income level one must achieve to become an evil rich person? If you listen to the progressive caterwauling, you would think it was at least a million dollars or more. Here is a look at what these cut-off figures were for each year 1980-2019.
This chart shows in 1980, any tax return with an adjusted gross income of $80,580 was considered the top 1% of returns filed. Single, married, head of household, or married filing separately is irrelevant. By 2019, you had to have an AGI of $546,434 to make the top 1%. These figures are strictly based on returns filed. In this next chart we see the income ceiling to be in the bottom 50% (the floor would be $0).
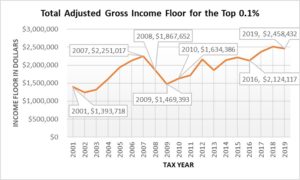
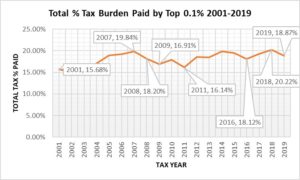
By 2001, the federal government started separating the “super rich” into their own category which is the top 0.1%. This means out of 100 million tax returns, the Top 0.1% would be only 100,000 of those returns.
Let’s look at the total federal income taxes paid as a percentage for these “super-rich” taxpayers.
These graphs disprove the progressives’ lies quite vividly. If I place the highlights into a single table, the message is even clearer.
| Percentage of Tax Share Paid per Group | Total Tax Returns Filed per Group | ||||||
| Tax Year | Top 0.1% | Top 1% | Bottom 50% | Top 0.1% | Top 1% | Bottom 50% | |
| 1980 | n/a | 19.05% | 7.05% | n/a | 946,000 | 47,293,000 | |
| 1990 | n/a | 25.13% | 5.81% | n/a | 1,128,000 | 56,406,000 | |
| 2001 | 15.68% | 33.22% | 4.90% | 119,379 | 1,193,710 | 59,685,000 | |
| 2019 | 18.87% | 38.77% | 3.06% | 148,246 | 1,482,460 | 74,123,000 | |
This shows you in 2001 there were 1,193,710 tax returns filed by the top 1% and they paid 33.22% of the total federal tax burden compared to the 59,685,000 bottom 50% of tax returns who paid only 4.9% of the total federal tax burden. Then by 2019, the third year of the Trump tax cuts show 74,123,000 bottom 50% of the tax returns paid even less of the burden at 3.06%, despite having 14,438,000 more tax returns filed than in 2001! While simultaneously, the top 1% went on to pay even more tax burden at 38.77%. Fair share argument, by definition, is now laid to rest. If the progressives want to return to pre-1940 where 100% of the tax burden is paid by the “rich,” they should be honest and say so, because claiming the rich need to pay their fair share is a blatant misuse of the phrase. The rich do pay their “fair share.”
The easiest way to prove the Tax Cuts and Jobs Act (the Trump tax cuts) were not just for the rich is to compare Barack Obama’s marginal tax rates and income levels to Donald Trump’s.
| Tax Brackets for Ordinary Income Comparison Between President Obama and President Trump Tax Policies (Tax Year 2018) | |||
| 2013-2017 (Obama) | 2017-current (Trump) | ||
| 10% | $0-19,050 | 10% | $0-19,050 |
| 15% | $19,050-$77,400 | 12% | $19,050-$77,400 |
| 25% | $77,400-$156,150 | 22% | $77,400-$156,150 |
| 28% | $156,150-$237,950 | 24% | $165,000-$315,000 |
| 33% | $237,950-$424,950 | 32% | $315,000-400,000 |
| 35% | $424,950-$480,050 | 35% | $400,000-$600,000 |
| 39.60% | $480,050+ | 37% | $600,000+ |
Source: https://files.taxfoundation.org/20171220113959/TaxFoundation-SR241-TCJA-3.pdf
Another important aspect of President Trump’s tax plan was his increase of the standard deductions from $6,500 single filer (Obama) to $12,000 (Trump), and married increased from $13,000 to $24,000. This means if you just take the standard deduction (no itemization) you get to write off the first $12,000-$24,000 of your income before any taxes are applied under President Trump’s policy, compared to only $13,000 under President Obama’s. This is quite significant. How significant? Well, according to the Tax Policy Center because of the Trump tax cuts a full 44% of the American taxpayers paid zero federal income taxes at all. This was a 2% increase from 2017 before the Trump tax cuts were implemented. The actual number of households not paying federal income taxes grew in every quintile in 2018 except for the top 20% of wage earners. Yes, because of Trump’s tax cuts, fewer Americans/families had to pay federal income tax; roughly 2 million fewer people.
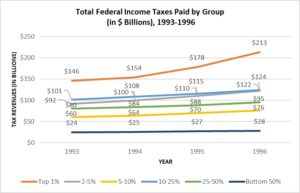
How about this progressive lie: nobody making less than $400,000 will see their taxes increase under the Biden plan. Keep in mind, 46-47% of people already pay no federal income taxes, and President Biden claims just increasing the top 37% rate back to 39.6% and increasing multiple business taxes, capital gains taxes, and various wealth tax ideas will “pay for” his new budget. There is no way his $5.8 trillion budget can be paid for by just taxing the >$400,000 crowd an extra 2.6%. The math doesn’t work. Biden sounds a lot like Bill Clinton who told Americans on October 31, 1992 he was going to raise the top tax rate from 31% to 36% on families over $200,000 income and singles over $150,000 and give “middle class” families under $80,000 small tax breaks. The $80,000-200,000 people would see no changes in their tax burden. Clinton’s lie is easily demonstrable if you look at the chart taken from my book on page 307.
Figure 15.13 Total Federal Income Taxes Paid by Income Group, 1993-1996
Every single income group showed an increase in their tax burden after Clinton’s tax policies were implemented. In a New York Times article written by R.W. Apple on February 18, 1993, roughly six weeks after Clinton became president and addressed a joint session of Congress, “Mr. Clinton outlined a series of new taxes that would fall most heavily on business and on relatively wealthy individuals, both active and retired. But families earning as little as $20,000 a year—members of the “forgotten middle class” whose taxes he promised during his campaign to cut—will also be asked to send more dollars to Washington under the President’s plan.” He lied in October 1992 and tried to blame the reasons on “the previous administration.” Sound familiar?
Given the predictable rhetoric from President Biden, which echoes the same sentiments as Bill Clinton, it is safe to say those who he claims will be given tax breaks will not see such reductions. You cannot give federal tax breaks to people who already do not pay any federal income taxes. But you can increase their tax burden, in order to “build back better.”
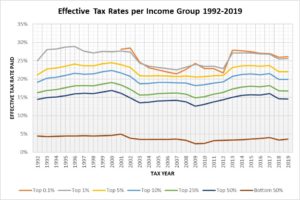
The fourth lie is as easily disproven as the previous three; actually, even easier. A simple review of effective tax rate data shows the actual percentage each income group pays, on average, every year.
It’s simple to see the “secretary of the CEO” is paying less in income tax rates than her boss. Progressives like President Biden try to mix tax rates when they make this claim. They are looking at CEO capital gains tax rates and comparing those to the secretaries’ effective income tax rates. This is apples to oranges comparisons, and these politicians know it, but choose to mislead (aka, lie) to the public.
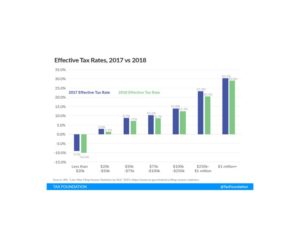
Finally, here is a second source on this topic from the Tax Foundation. This graph also lays bare the second lie because it compares effective tax rates before the Trump tax cuts and after. Notice again, everyone’s effective tax rates went down.
There are so many additional examples I could have placed in this article, but space is limited. My book is 493 pages of data and proof, and I merely scratched the surface of the lies from both political parties being told to the American people. Please, do your own homework and never accept political spin at face value; neither party cares about you no matter what they might say. The only two problems your political figures desire to fix are winning the current election and the next one.

