Both of the Federal Reserve Bank’s stated policies of under-market interest rates and generating a minimum of two percent general price inflation are creating a permanent financial underclass in America by keeping home ownership perpetually out of reach for struggling lower-middle class American workers.
The goal of general price inflation—among many other impacts that disparately impact the poor—makes it much more difficult for people to save up for a down payment on a mortgage, especially during those fairly frequent times when the Fed exceeds its target level of inflation. And the tighter a family’s budget, the greater the impact that any given level of price inflation has on delaying a family’s goal of home ownership.
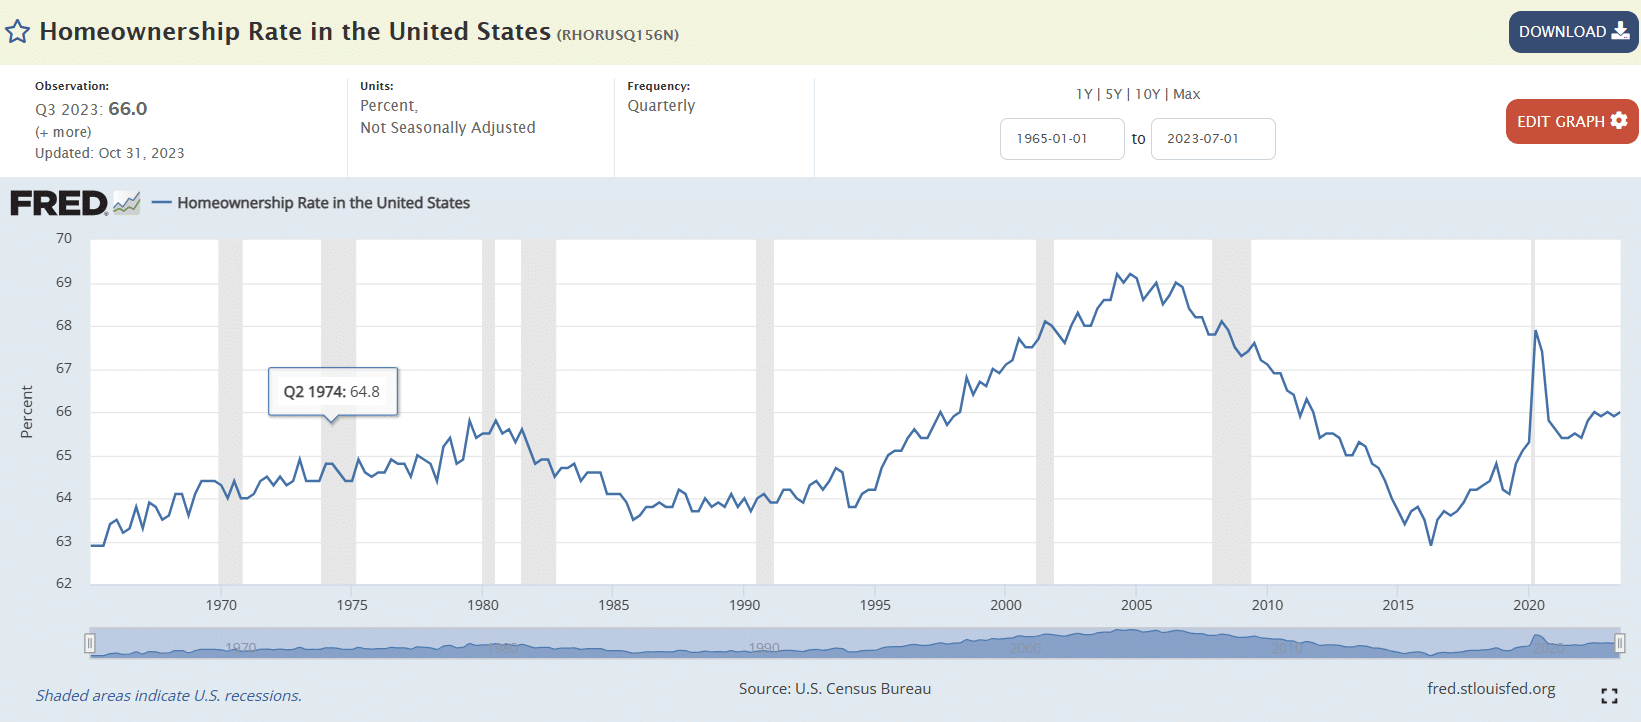
The U.S. Census documents sharp increases in the proportion of families owning their own homes during the post-war period right up until the early 1970s, the time period when inflation took off as Washington jettisoned the gold standard. From a low of 43.6% in 1940, the percentage of home-owning American families jumped to more than 64% by 1970. In the 53 years since then, despite a massive increase in the proportion of two-income families in the workforce, the proportion of home-owning families has remained largely the same.
Why is that?
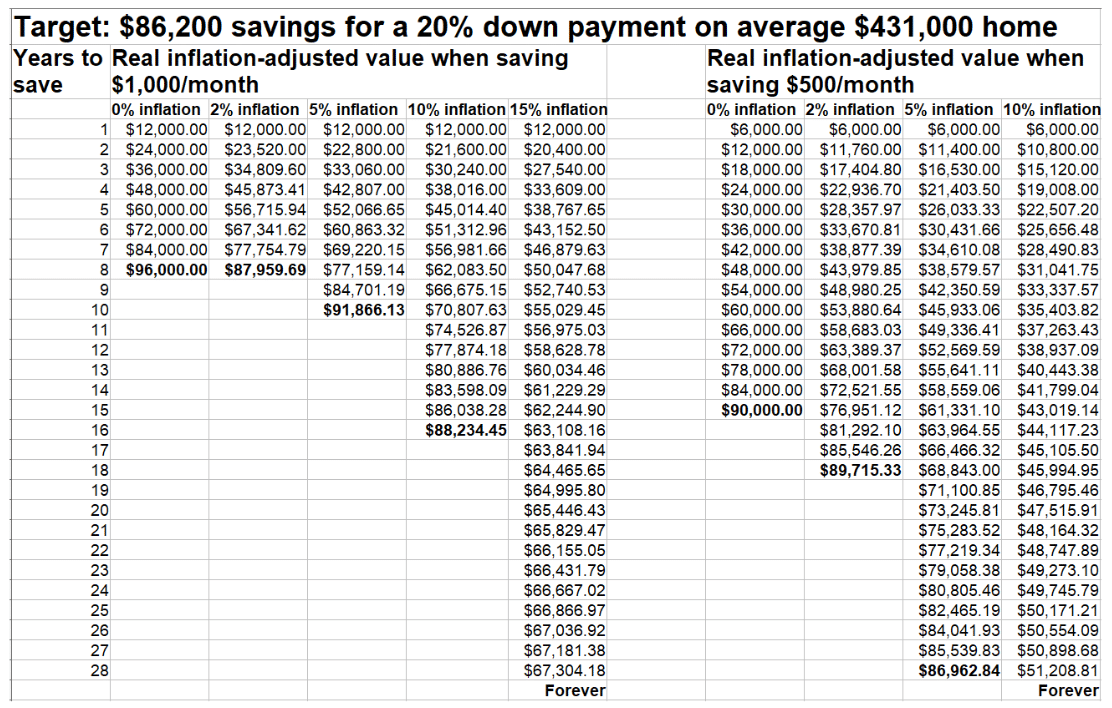
One half of the reason is inflation. Inflation makes it much harder for struggling families to save a standard down payment for a house, as the inflation eats away at the value of a savings account dedicated toward a home down payment. It’s simply a matter of numbers, if you look at inflation-adjusted numbers on a spreadsheet:
One criticism of the above spreadsheet could be that most people don’t put their savings under a mattress, but in a bank where it earns interest. But the typical bank savings account interest rate until 2023 was near zero. And while it has increased substantially in 2023, there remains a wide variance between the rate of inflation and the interest rate paid by banks in a savings or checking account—and the higher the rate of inflation, the greater the variance.
Note from the above spreadsheet that 10% inflation more than doubles the time it takes to save that down payment for people saving $1,000 per month—increasing the savings time from 7 ½ years to 15 ½ years. And a 15% inflation rate makes a $1,000/month savings rate an impossible feat to ever attain that down payment; it becomes the “never going to get a house” inflation horizon. Inflation eats away at the real value of the dollars saved as fast as the couple can save.
Note also that inflation impacts more sharply upon those with tighter budgets. While a 2% inflation rate only increases the savings time for the couple saving $1,000/month by a few months, the couple saving at half that rate must wait another three years longer because of inflation. Moreover, the couple saving $500/month will never save enough for a down payment with 10% inflation, while the couple saving $1,000/month will find their “never get a house” inflation horizon at about 15%.
In short, even 2% inflation robs working people saving $500/month toward an average home down payment of $18,000 in value, while it robs those saving double that amount about $7,000.
“It sucks to be poor,” the Federal Reserve Bank’s inflation policy essentially says to working stiffs.
From the above chart one can also see pretty clearly why hyper-inflation in countries like Zimbabwe, Venezuela, and Argentina has devastated the middle class by making savings all but impossible. In America, the rate of inflation has been lower, so the theft of value from younger workers trying to save for a house or a business investment is more subtle. The effect is the same, even if it is more gradual.
Another criticism of the above spreadsheet could be that saving 20% is rarely needed any more for a down payment to get into the housing market. The federal government tries to “help” first-time homeowners by lowering the down payment requirement to 5% (or even less for veterans and other groups favored by politicians). The banks and the financial industry don’t mind, because they get federal guarantees and get to charge “mortgage insurance” until the 20% threshold is attained, increasing their profits.
But these assistance programs only create massive systemic risk in the real estate market, as Americans witnessed with the housing bubble in the early 2000s, ending with the 2008 housing crash that created massive unemployment and general financial instability. That crash is also related to the Federal Reserve Bank’s other policy goal of artificially suppressing interest rates.
The Federal Reserve Bank created the economic crisis by spurring speculation in an era of low interest rates while other federal programs were guaranteeing low down payments. Lowering the down payment level simply increases the risk of systemic default by giving marginal buyers an incentive to walk away from their mortgages when the housing bubble pops, as American workers found out in 2008-2009.
Thus, the percentage of Americans owning homes shot down from all-time highs in 2007 to depths not seen since the 1960s by 2015. Federal home assistance programs obviously didn’t help at all, and on net, actually made the market a bit worse than before.
Those lower interest rates and lower down payments that bring on economic crises like the 2008-2009 financial downturn don’t help working people. Many millions lost their jobs, and subsequently more than five million workers lost their homes when they were unable to afford the payments. Moreover, the equity they had thought they had built up in their homes evaporated suddenly at the very same time they were forced to sell the homes back to the banks.
It was very convenient for the banks, who got bailouts from the government and were able to acquire the homes at bargain prices. American workers, however, didn’t get any bailouts.
So workers had to start over, often without even the meager down payment they had saved up the first time.
But there’s more bad news. The above spreadsheet optimistically assumes that wages will rise in tandem with prices, as measured by the Consumer Price Index (CPI) that is generally used as a metric for the rate of price inflation. This will allow savings to be adjusted upward, so a $1,000 savings this year will be increased to $1,030 next year to account for 3% inflation without any additional pain. It also assumes housing prices won’t rise faster than the CPI.
If either of those assumptions are wrong, saving for a home will take longer, on average, than what the spreadsheet forecasts.
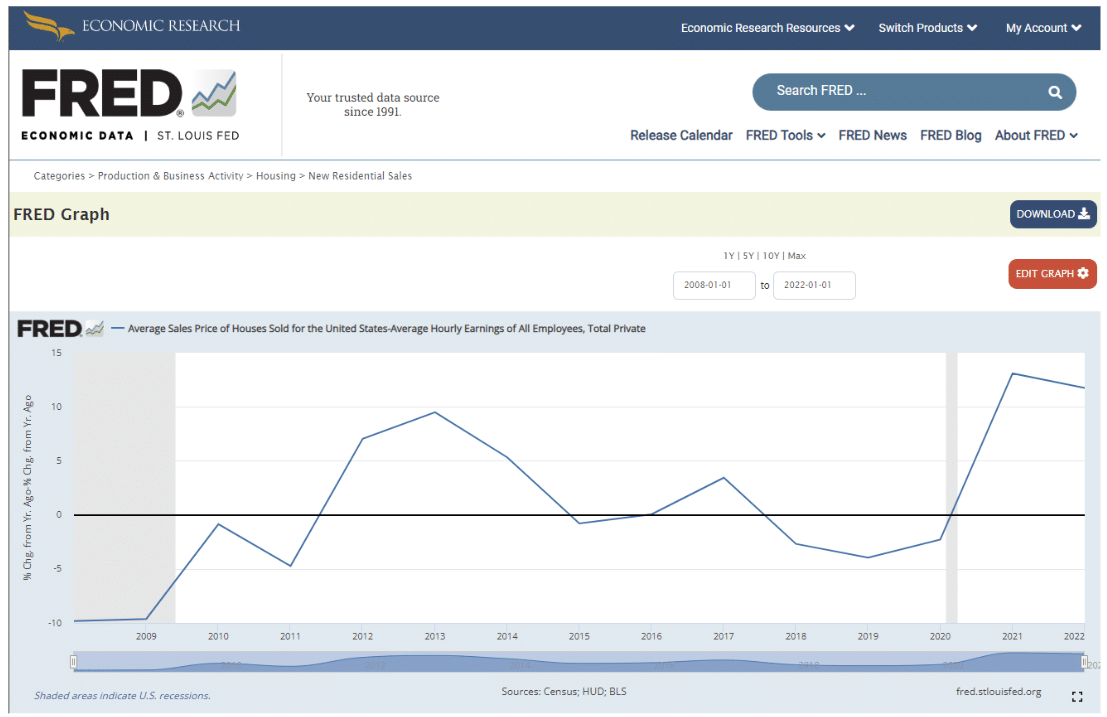
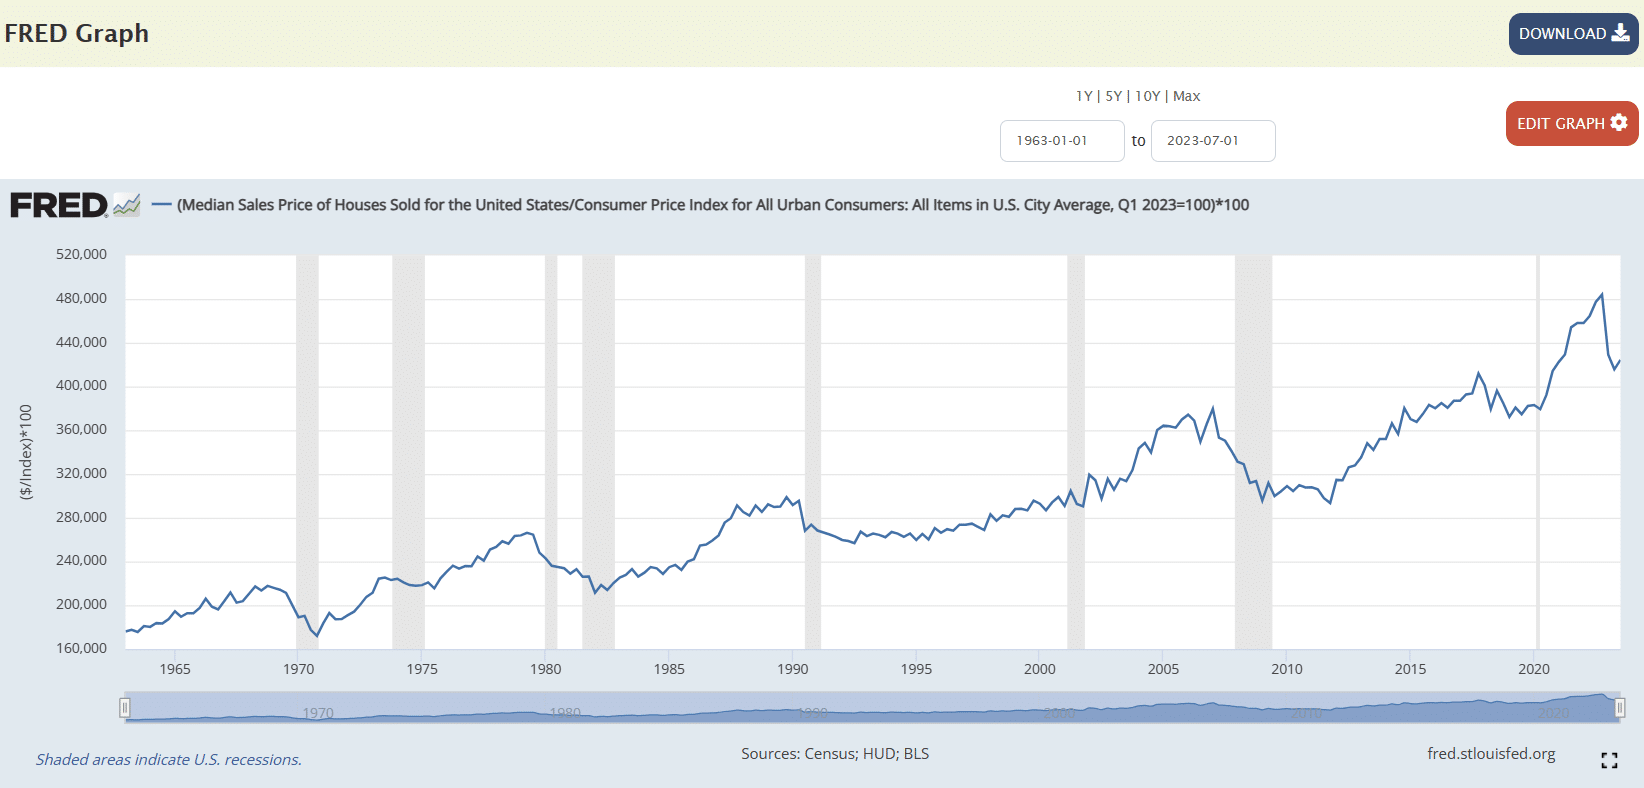
And neither of those assumptions have been true since 2020. Housing price inflation greatly outpaced general price inflation in 2020-2022 as measured by the Consumer Price Index. Moreover, average wages have fallen since 2021 after adjusting for the CPI.
While 2023 will show major improvement in housing prices once the final numbers come out, 2021 and 2022 were both years in the “never going to get a home” inflation horizon when comparing the difference between the increase in housing prices and the increase in salary prices for average couples.
2021-2022 were the two years when housing prices made the greatest strides toward being unaffordable in recorded history. The reality is that young working people are being screwed by the system, and the system is engineered by both of the Federal Reserve’s policies to screw them financially.
Lower interest rates have a direct and strong upward impact upon the sale price of houses. This statement is based upon common sense intuition as well as modeling using modern econometrics.
The common sense intuition is that property prices, which are typically financed by mortgages, are highly dependent upon the monthly mortgage payment level. If the interest rate falls, the monthly payment falls in the short-term, but climbs back up to its previous equilibrium as the sale price creeps up from market pressures. In short, the biggest factor in housing prices is not the sticker price, but the monthly payment price.
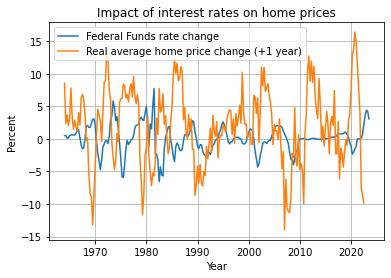
Econometrics validates this intuition. The real (CPI-adjusted) average annual change in the sale price of American houses measured against changes in the Federal Reserve Bank’s “Federal Funds Rate,” the discount interest rate the Fed gives to its member banks, yields a very strong inverse connection. Using data from the Federal Reserve Bank of St. Louis’ databank FRED, a visual inspection of a line graph of the annual change in the average home price in the United States against changes in the Federal Funds Rate (below) shows that even slightly lower interest rates increases much higher real (CPI-adjusted) housing prices, typically after the one-year delay represented in the graph.
When interest rates go down, housing prices go up the following year. And when interest rates rise, housing prices fall the next year.
The relationship of the two data points are statistically significant at the 1% level (with a Z-score of -5.4 for the fellow economist dweebs reading this). While there’s a lot of variables determining housing prices, interest rates is a key one.
Real (CPI-adjusted) median home prices have more than doubled—a 100% increase—since the 1960s and early 1970s. Meanwhile, real median wages have only increased 10%—merely one-tenth as fast.
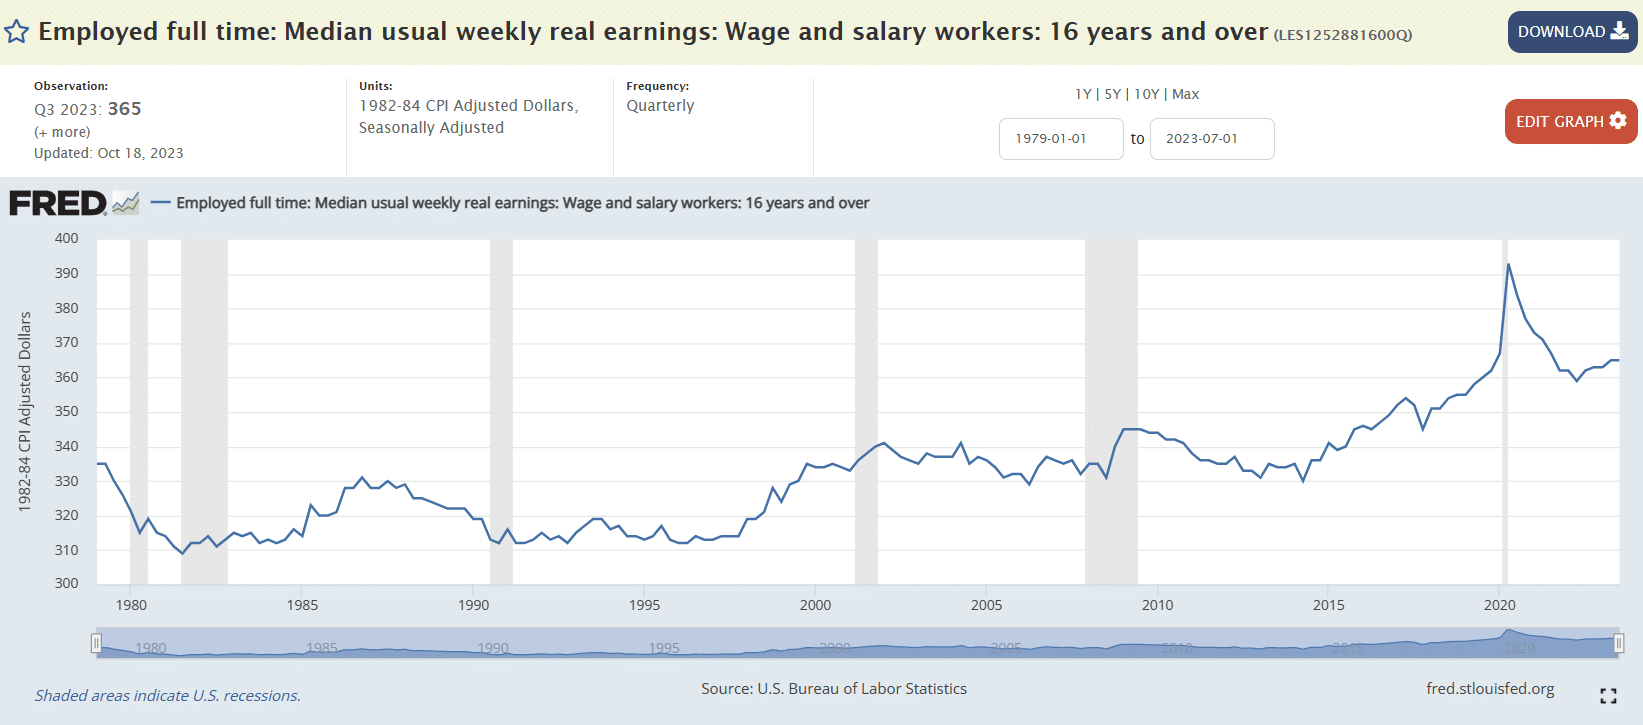
This means housing is becoming more unaffordable for average Americans, even absent the pressures of general price inflation, and the driving force of that is the Federal Reserve’s policy of low interest rates.
The cure for the economic stagnation imposed upon working people is abolition of the Federal Reserve, a return to market interest rates, and restoration of a sound dollar that does not create general price inflation. The question is: When will the political will by working class American voters be generated to demand it?

