What would the political left (and for that matter, the right) do if they found that one of the biggest factors in income inequality was not top income tax levels, but inflation?
It might lead to a revolution and a grand coalition among people of ideologies across the political spectrum against the political establishment. Income inequality is clearly a complex phenomenon, subject to many variables. But the intuition behind the rich getting richer from lower tax rates is probably a little easier for people to accept at face value than the argument that the rich are getting richer from inflation.
The intuition that low income tax levels among the wealthiest contribute to their income is obvious: if they can keep more of their own money, they can invest more of their own money and earn higher incomes. Even the political right will concede that if the federal government cuts high income tax brackets—which were over 90 percent in the post-war period—the wealthy are more likely to declare their income rather than hide it in their corporate investments. The former tends to increase the real wealth of top income earners, while the latter would make the wealthy declare a higher share of their real income for the official records as top rates flow downward toward the left half of the Laffer Curve.
The intuition behind inflation contributing to income inequality is less obvious, but still undeniable. Inflation—because it lowers the purchasing power of the dollar—hurts people holding or owed dollar-denominated assets, and helps those owing dollar-denominated assets. So it helps debtors and hurts creditors. Most people tend to think of the poorest people as those holding the most debt, but the poor tend not to have enough credit in order to get into debt.
Counter-intuitively, poor people tend to be net social creditors. Laborers credit their employer with a week or two of their wages while they await payday. And when laborers get their pay, they credit the bank with their wages when they deposit them into their checking accounts. Renters credit their landlord when they advance their rent and security deposit before they live in their apartments. Often times, renters are forced to advance payments (i.e., credit) to utilities before they get their power and other utilities turned on. The value of all of these credits are depreciated by inflation, which typically has at least a 3-4 year lag before the full impact of the increase in money creation is felt in the form of increases in the Consumer Price Index (see the graph below).
The intuition of the latter is that there is a known lag between creation of new money (what has traditionally been called “inflation”) and rising prices (the modern understanding of inflation in the form of the Consumer Price Index). An increase in the M2 money supply (cash, checking accounts, money market funds and savings accounts) takes three years to have its maximum impact (see chart showing the statistical impact of one percent M2 creation since 1960, below, using statistics from the Federal Reserve Bank) upon consumer prices, and likely has some impact as far out as five years after money creation. The primary beneficiaries of new money creation are generally believed to be those who get the new money first, before the prices are bid up, while the losers are those who see the money only after prices are bid up. Government gets new money first, then the financial sector, and finally the people generally.
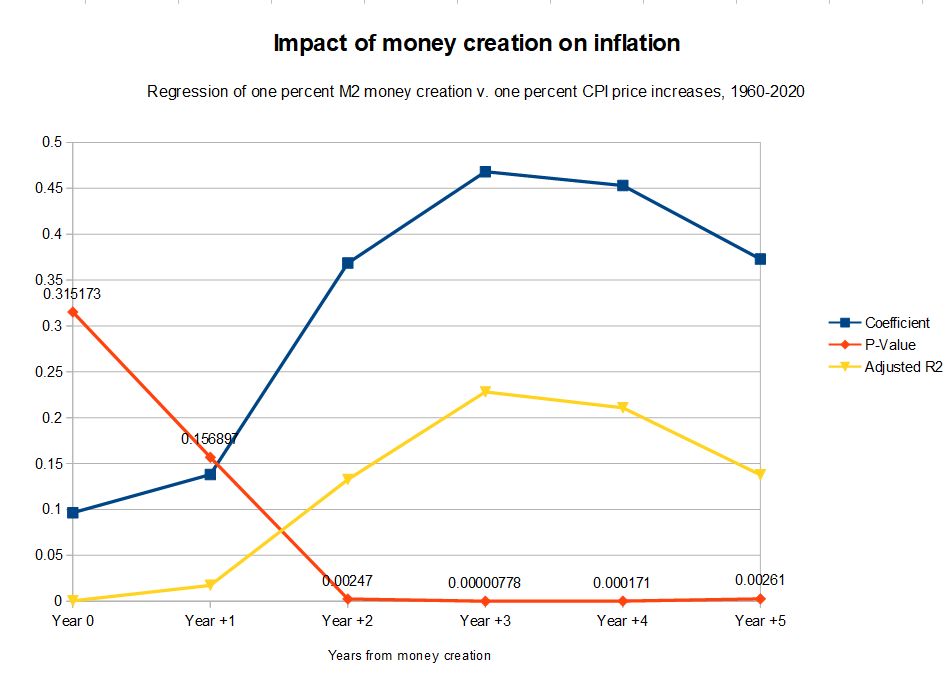
Delay in price inflation from money creation: Coefficient represents the proportion of change from a one percent increase in M2 money upon inflation per year, P-value represents whether the coefficient is statistically significant (less than 0.05 is generally regarded as statistically significant) and Adjusted R2 represents the proportion of the variation in prices that money creation explains in that year.
On the other hand, the wealthier a man is, the more likely his assets are to be largely immune to inflation. Stocks, commodities and other hard assets appreciate proportionately with inflation, and real estate is largely purchased on credit with a mortgage, which inflation tends to make the real cost lower in proportion to the severity of the inflation.
One extreme example of this I’ve told elsewhere is of a Venezuelan friend who bought a home for about 300,000 Bolivars in 2007 (roughly $25,000). After five years of payments, he still owed far more than half the principal, but his monthly payments had fallen from more than $100 to less than $1 because of hyperinflation in Venezuela. That year my friend was able to pay off his the entire mortgage for less than a single day’s pay as a laborer in the United States earning American dollars. Clearly, my friend had been helped by inflation with his mortgage. So it is—on a slower scale—with all wealthy American real estate developers, whose mortgage payments gradually get easier as inflation increases.
The table below represents a linear regression for changes in the share of income declared by the top one percent of income earners since 1913 against top income tax rates and inflation rates with a one year advance (i.e., comparing 1913 income changes against 1914 Consumer Price Index rates).
The result of the linear regression in the table below shows that a one percent increase in inflation would appear to have the same effect on income inequality as a seven percent reduction in the income tax for those in the top income bracket (note coefficient estimate of 0.064667 v. -0.009275).
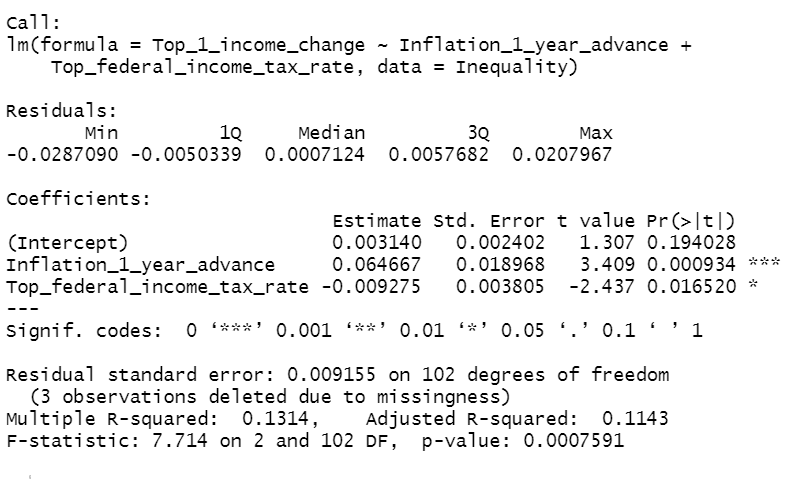
A few things should be pointed out by the above “Ordinary Least Squares” (OLS) regression. The computer program (I used the open-source program “R”, but it can be replicated in many other programs) draws a straight line with the least variance for each of the variables, and then tells us how much of the variation those variables may explain in the form of the Adjusted R Squared variable. The program suggests that both top income rates and one year before the CPI records price inflation are statistically significant variables (generally, a P-value less than 0.05), but that both variables taken together probably only explain 11 percent of the variance.
This suggests, as we might expect, that there are clearly lots of other variables making these changes in the share of the top 1 percent’s income share. These might include economic bubbles and busts (such as real estate and stock market crashes), government subsidies of corporations or other factors.
That much being said, the intuition behind inflation increasing the share of income earned by the wealthiest one percent is consistent with the data. Moreover, higher inflation is a much stronger predictor of both the top one percent of income earners gaining share (and lower income earners losing share) than is top income tax rates.
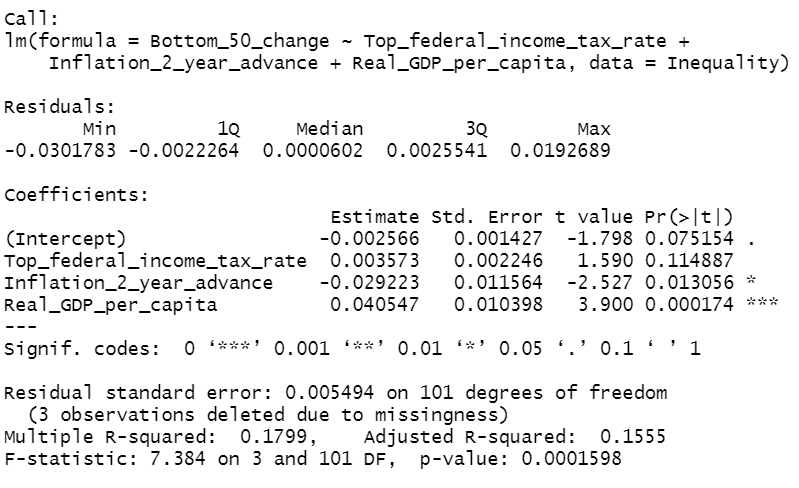
Ironically, the share of the income earned by the bottom 50 percent doesn’t show any statistically significant difference over marginal taxes for the richest Americans. For the poor, real per capita economic growth is the biggest factor, followed by inflation, with the largest effect just one year after money is created and two years before that money creation has its maximum impact upon the Consumer Price Index. (see chart below)
Part of the problem with blaming the Reagan income tax rates on the wealthy as the reason for the increasing share of income enjoyed by the wealthiest one percent of earners is that the share earned by this group was at its lowest in 1976, six years before the Reagan tax cuts could have had any impact whatsoever, while the share earned by the bottom 50 percent reached its maximum in 1969 (see graph below). And 1969 happened to be the first year CPI passed the five percent marker since the end of the Second World War, inaugurating a 40-year non-stop increase in consumer prices that (with the exception of 2009) continues to this day.
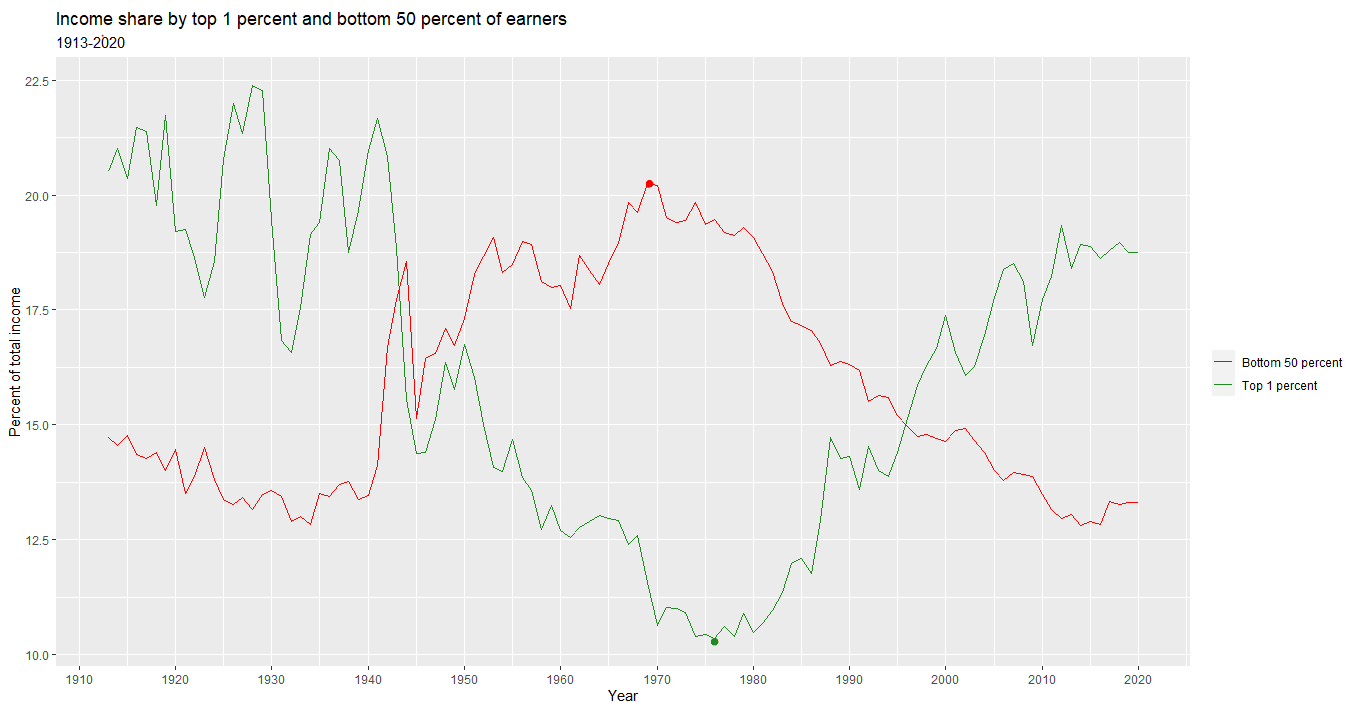
On the other hand, the increasing progress of the bottom 50 percent was largely cut off once inflation began to take off and the United States prepared to jettison the gold standard (which it did in stages in 1971-74) in favor of a floating currency.
The problem with the floating currency was that it was less like a boat floating on the water and more like a helium balloon that continued skyward infinitely. And that’s particularly been the case lately, with the Consumer Price Index increasing by as much as nine percent over the past year.
The data show that eliminating the current nine percent inflation under the Consumer Price Index would have the same impact upon income inequality as raising the top income tax rate to 91 percent from its current level of 37 percent.
The impact may actually be larger, since inflation tends to lower per capita economic growth, one of the highest factors of wealth share among the poorest 50 percent of Americans.
The Federal Reserve Bank remains committed to maintaining CPI inflation at the level of more than two percent indefinitely. But Americans across the political spectrum interested in more economic growth, an income distribution that doesn’t steal from the working poor through the mechanism of currency inflation, and a genuinely stable dollar not losing value perpetually, will have to challenge the Fed’s policies aggressively in order to set America’s financial house right.