")
Break out your mom’s bell-bottoms and dad’s leisure suit from your parents’ attic. It’s 1979 again (at least economically)
Don’t listen to the perpetual doomsayers who claim this is the beginning of the big crash. It’s not.
Yes, the American economy is a huge mess, and the economy is going to get a lot worse.
But no, it’s nothing like the housing crisis of 2008 or the 1929 stock market crash that began the Great Depression. It’s not even remotely similar.
There Won’t Be a Housing Crash
It’s true the housing crisis of 2008 was created by some of the same factors we have in our economy today: super-low interest rates, speculation and fast-rising housing prices, and loose loan terms.
But today several important variables are different. First, and most importantly, we have high price inflation across the board. The Consumer Price Index (CPI) will probably increase by 10 percent or more this year. A big part of the problem in 2008 was that the housing crash in home value resulted in a large number of home mortgages being underwater in their valuation. This caused home values to plummet even further after millions of Americans just walked away from their homes.
That won’t happen because today a house that loses 10 percent of its real value will see no change in its nominal price because of 10 percent price inflation rates. Millions of home-buyers will not be underwater in their mortgages as they were in 2008.
Moreover, real interest rates—at least thus far—continue to plunge to new historic lows (see graph below), meaning that massive housing speculation and over-valuation of real estate will continue even during the beginning of this era of price inflation. By way of contrast, in 2006-07, interest rates had already been raised to real positive rates that ended the wild speculation.
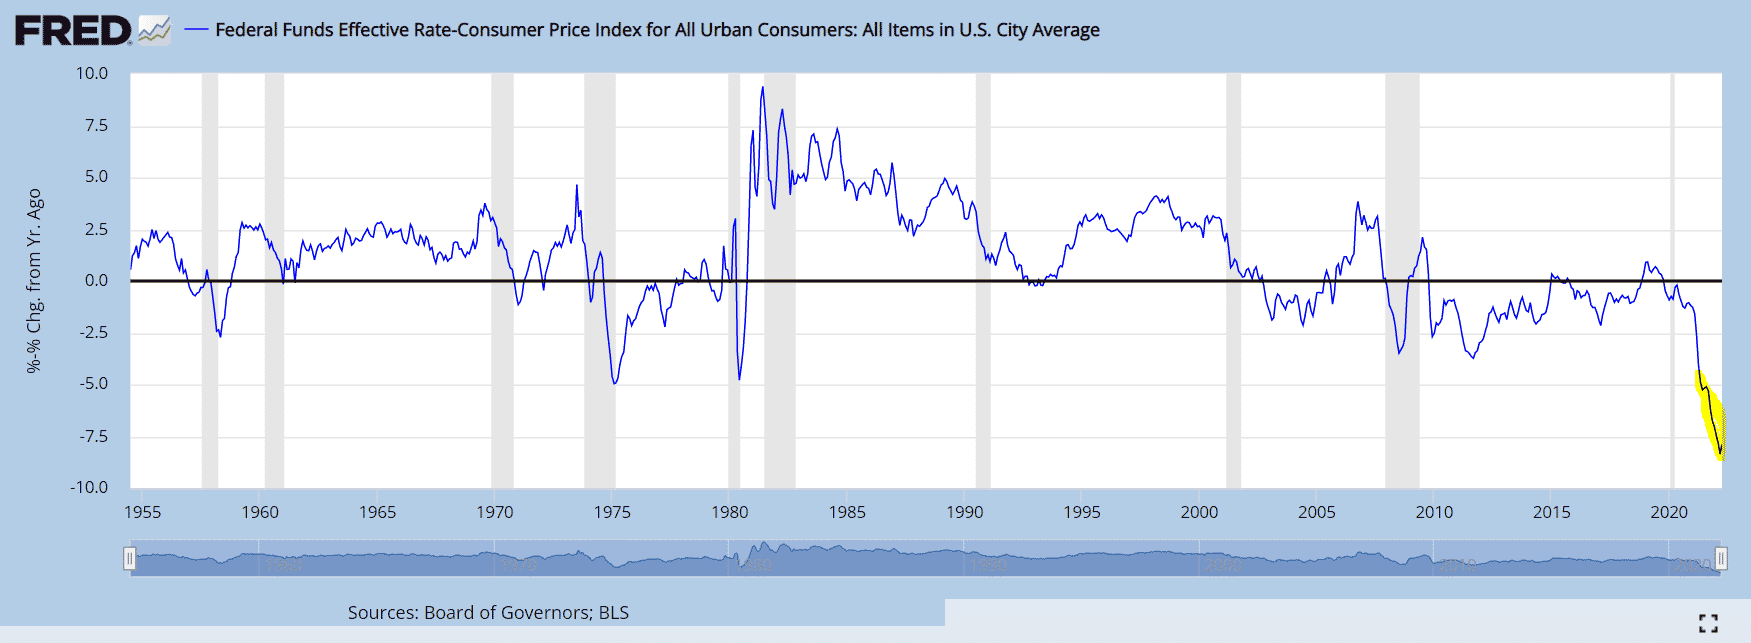
Of course, the Federal Reserve Bank could raise interest rates like Paul Volcker did in the early 1980s to near the 20 percent level. That would crush the housing market, perhaps even faster than the inflation rate would increase nominal home values. But thus far Jerome Powell and his cronies haven’t shown the stomach for such rate increases. In fact, the chart above shows that the recent nominal rate increases in the Federal Funds rate thus far—from virtually 0 percent to 0.75-1.0 percent—have been nothing more than speed bumps on the downward plunge into ever-newer record low negative real interest rates.
The Coming “Malaise”
President Jimmy Carter caught a lot of flack in 1979 for his “Malaise” speech, officially titled “Crisis of Confidence.” Though Carter never used the word “malaise,” Americans of the time knew something was wrong but couldn’t quite pin-point the problem. They saw the effects, however, in the form of increasing unemployment and ever-rising prices.
Those are the effects Americans will slowly start to see over the next couple of years.
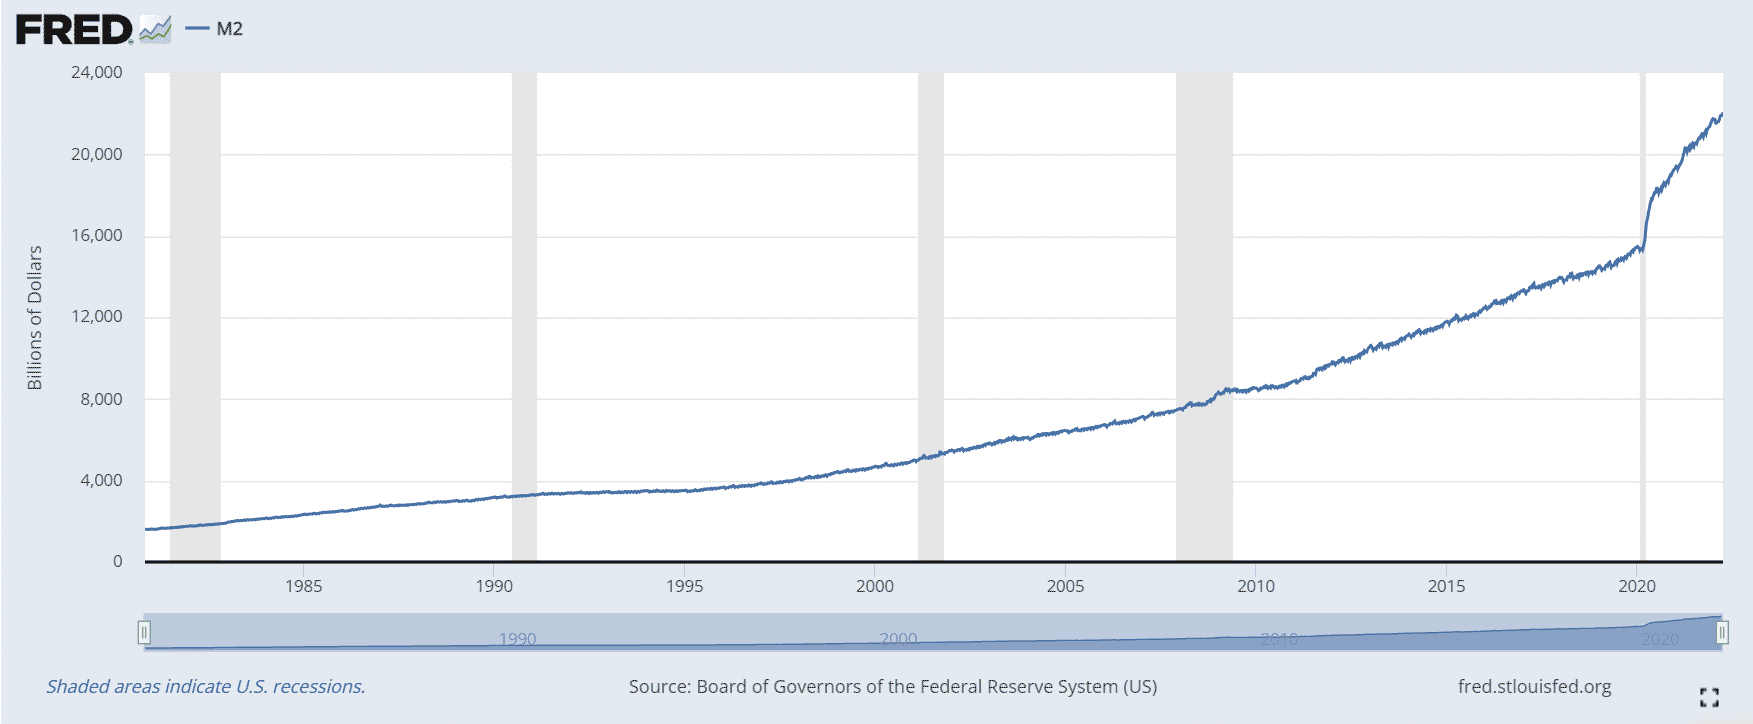
Inflation has likely not even hit its peak yet, if the past is any indicator of the future. The federal government engaged in a massive money-creating venture in the wake of the COVID crisis in 2020-21, a money-creating effort that has not yet returned to historical normal levels. Below is the chart of the amount of M2 circulating in the United States, a definition of money that essentially includes cash and demand deposit accounts. It shows a fairly sharp increase in 2020, against a milder general upward historical increase.
A better metric to see the magnitude of the increase is to measure the annual rate of increase in M2, and then compare it to the impact upon historic inflation rates. When we do this (see chart below), we find that 2020 saw the highest proportional increase in the amount of money in American history, at almost a 25 percent increase in that year alone.
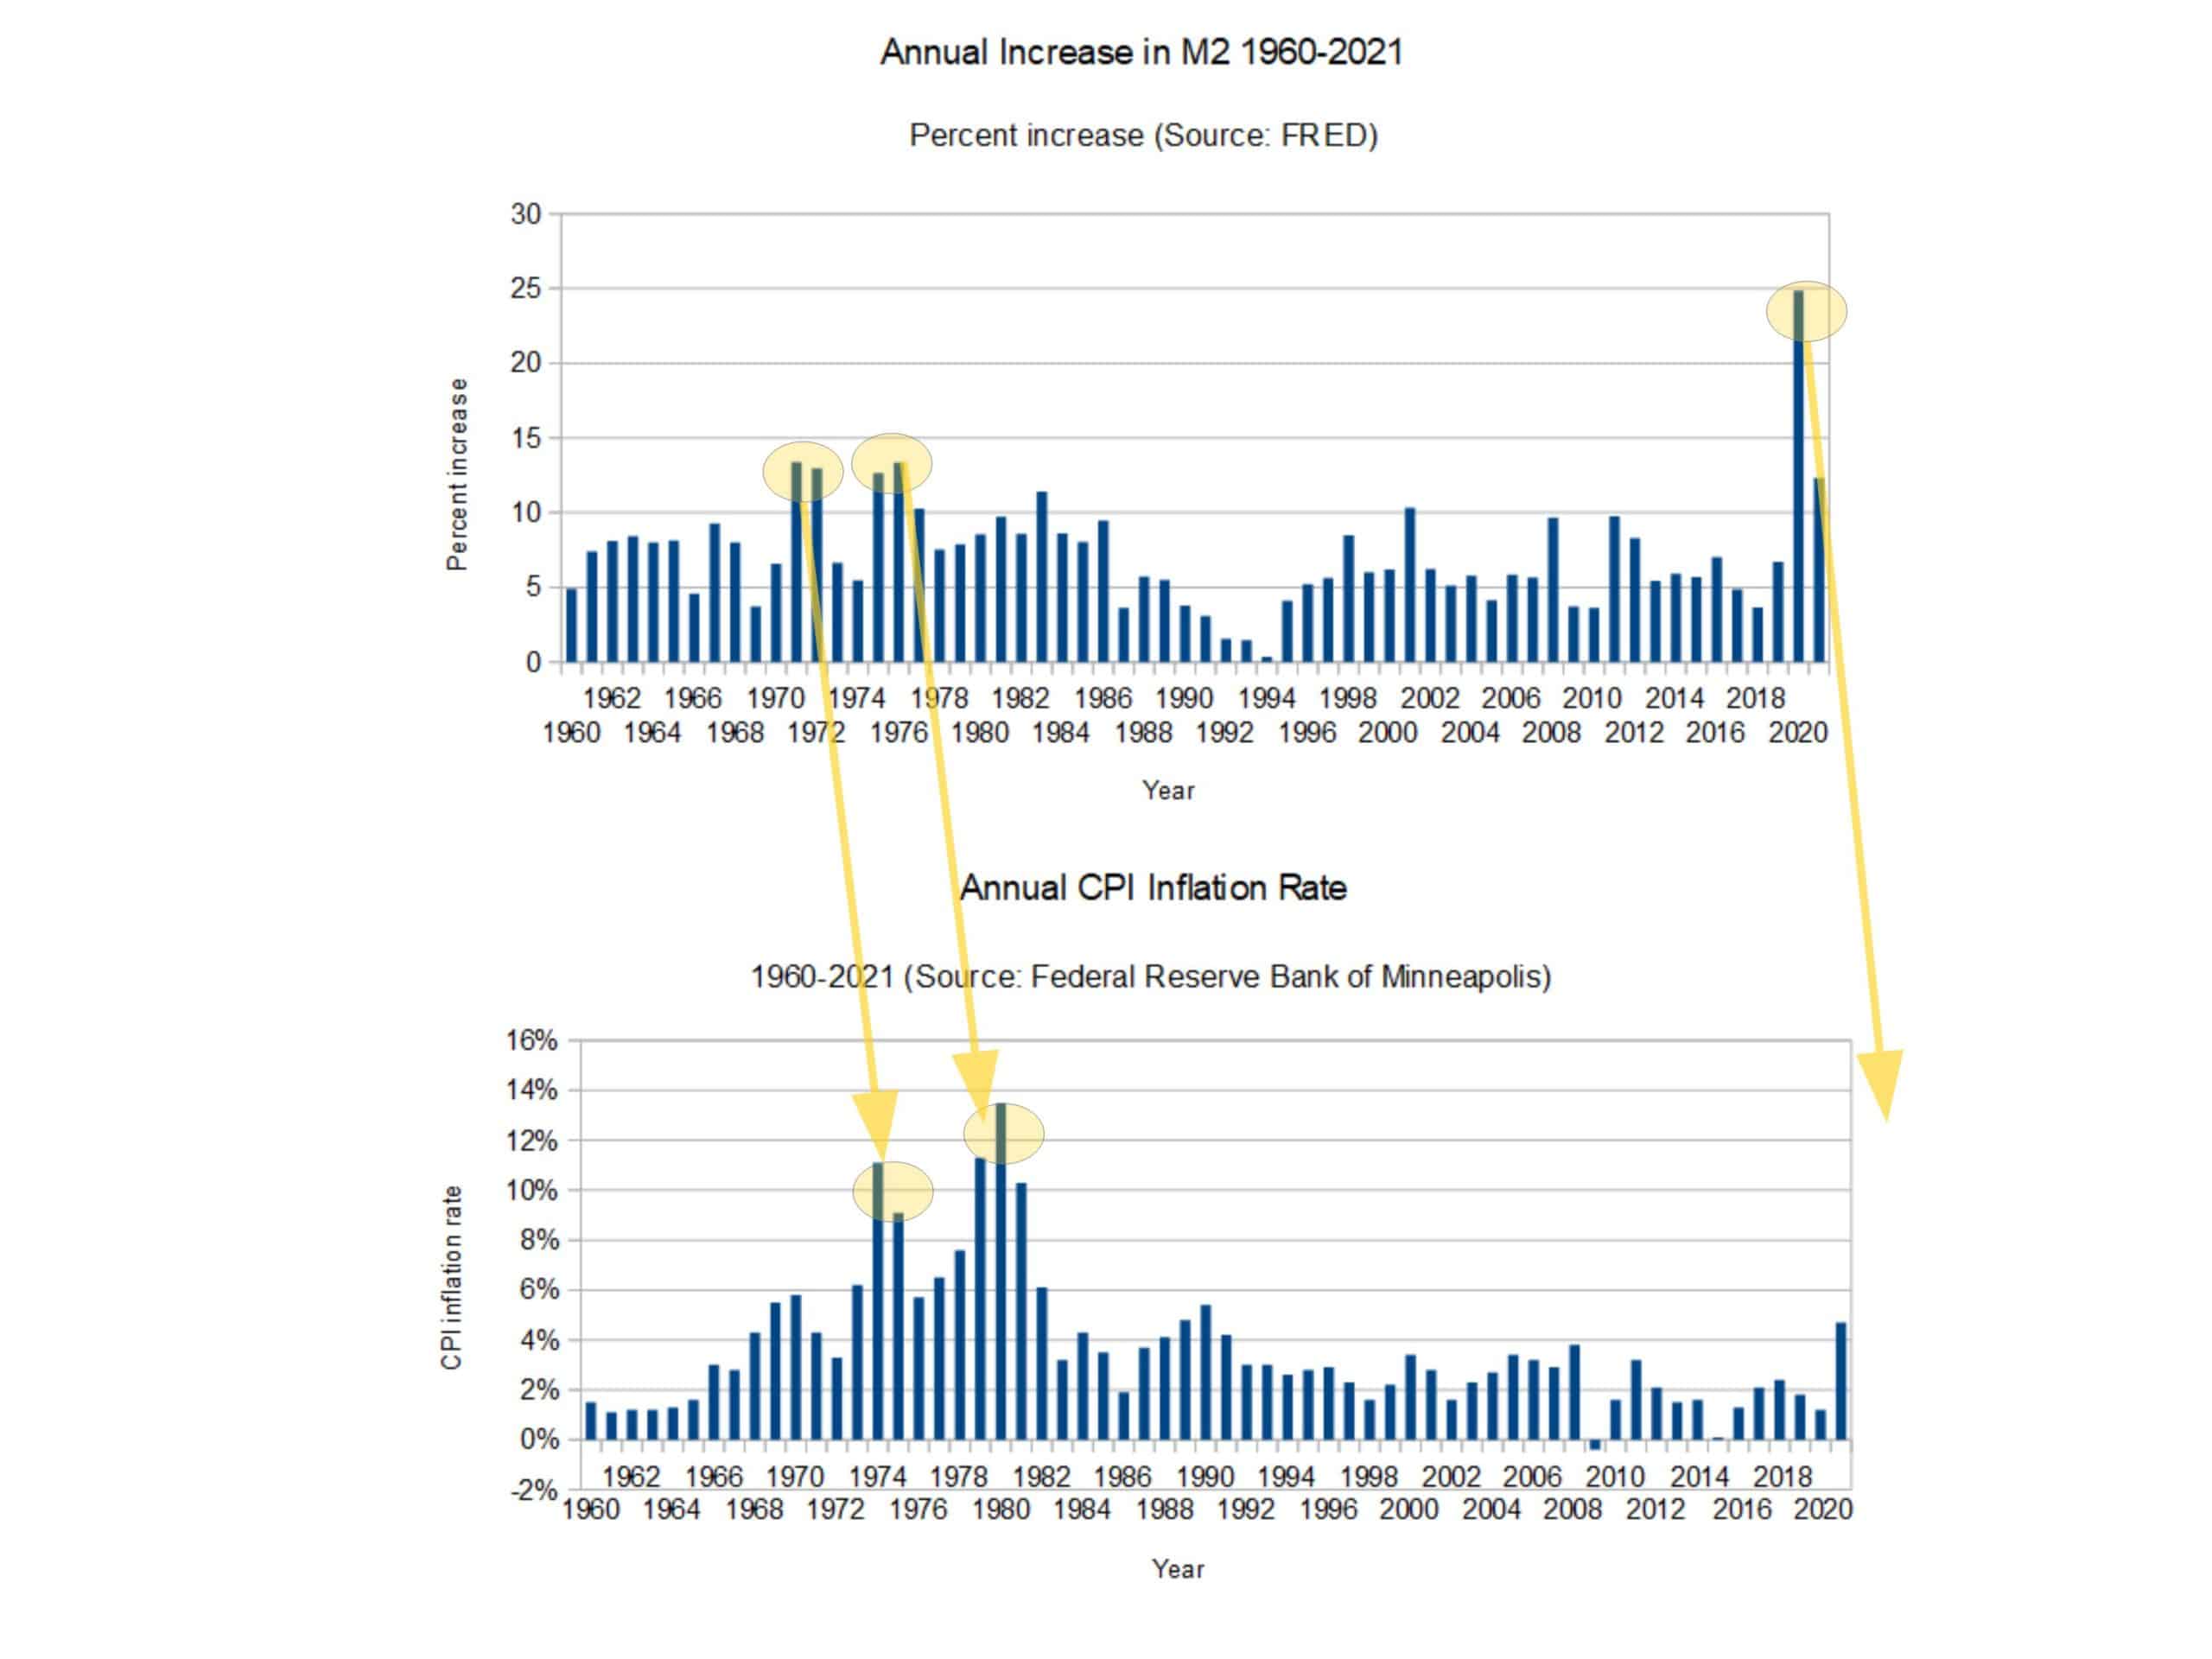
What we also find is that a large increase in the quantity of money (10 percent or more increase for two years) did not result in immediate CPI price inflation. To the contrary, the price inflation resulting from 1970s money creation was delayed by three or four years.
Price inflation as measured by the U.S. Labor Department’s CPI has as a general rule kept to the level of the percent increase in the supply of money minus the percentage increase in the amount of goods produced as measured in Gross Domestic Product.
Even gold is inflationary in the sense that it increases the amount of currency in circulation. A lot of people don’t think of gold as inflationary, but it is. As much gold as is mined in a year, it increases the supply of money under a gold standard. If the rate of gold mining exceeds the increase in production, you have price inflation. But the supply of gold typically increases about one or two percent annually while global production increases a bit more than that. Thus, a gold standard is considered mildly deflationary according to modern economists if they measure inflation in price levels.
Similarly, the mining of silver—a more common mineral than gold—typically keeps pace with global GDP increases, or a little more than that, and thus a silver standard is considered to be have a mild inflationary impact upon prices.
The delay in the time period from money production to price inflation may be a bit shorter today than it was in the 1970s, as money can now be spent at the speed of light digitally. This phenomenon of delay is observable in the form of the money creation impact upon personal savings rates after “stimulus” checks were sent out in 2020. Much of the money created sat in people’s savings and checking accounts throughout the pandemic, and initially didn’t bid up prices. The former can be observed in FRED’s chart on personal savings rates; note the record increase in personal savings rates during the pandemic, when people were getting extra checks during the shutdown period and not allowed to spend it on entertainment (see chart below).
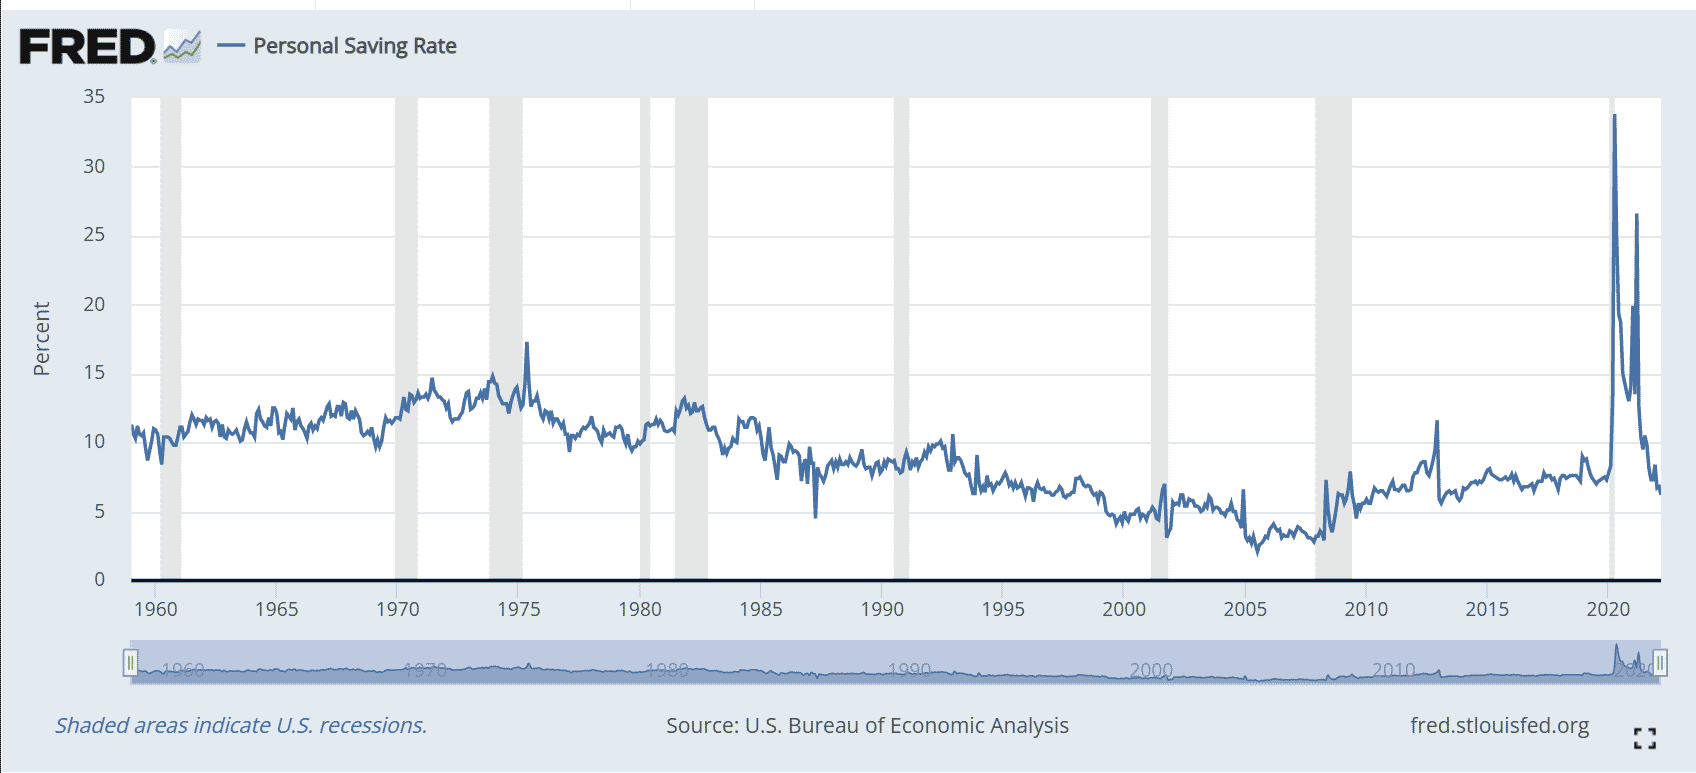
The chart above also shows that the massive increase in the personal savings rate—a modern historical record—is now essentially spent. The money is now in circulation, beginning to drive up prices. And that explains the increase in CPI inflation rates, especially since August 2021, when the personal savings rate fell below 10 percent.
Inflation: Slow-Motion Repudiation of the National Debt
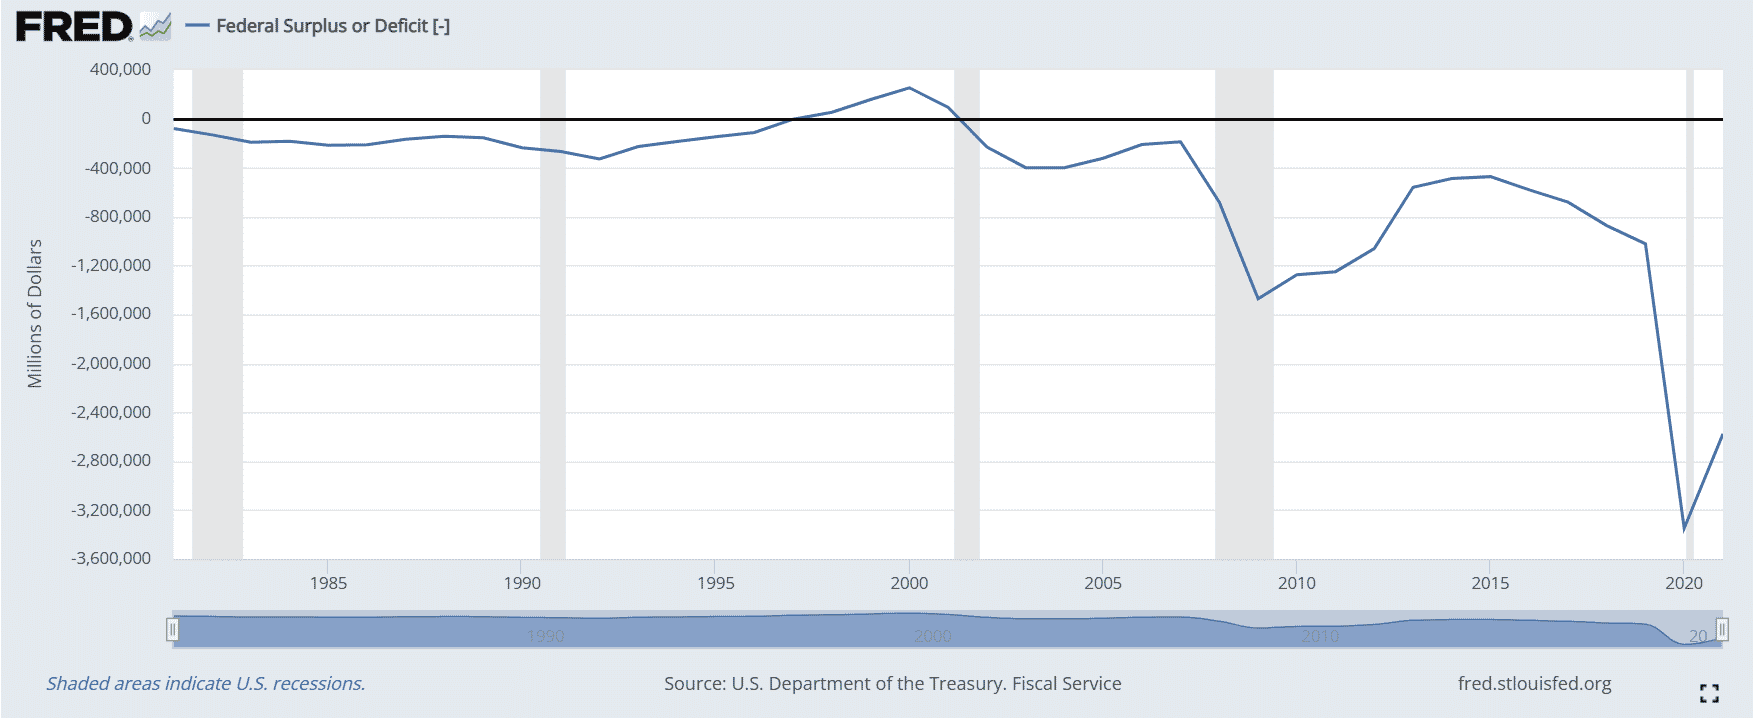
Inflation always has a disparately negative impact the poor, but the news about inflation is not universally bad from the federal government’s perspective. Despite record annual budget deficits (see below), the federal government’s debt-to-GDP ratio has actually decreased in the past year (see second chart below).
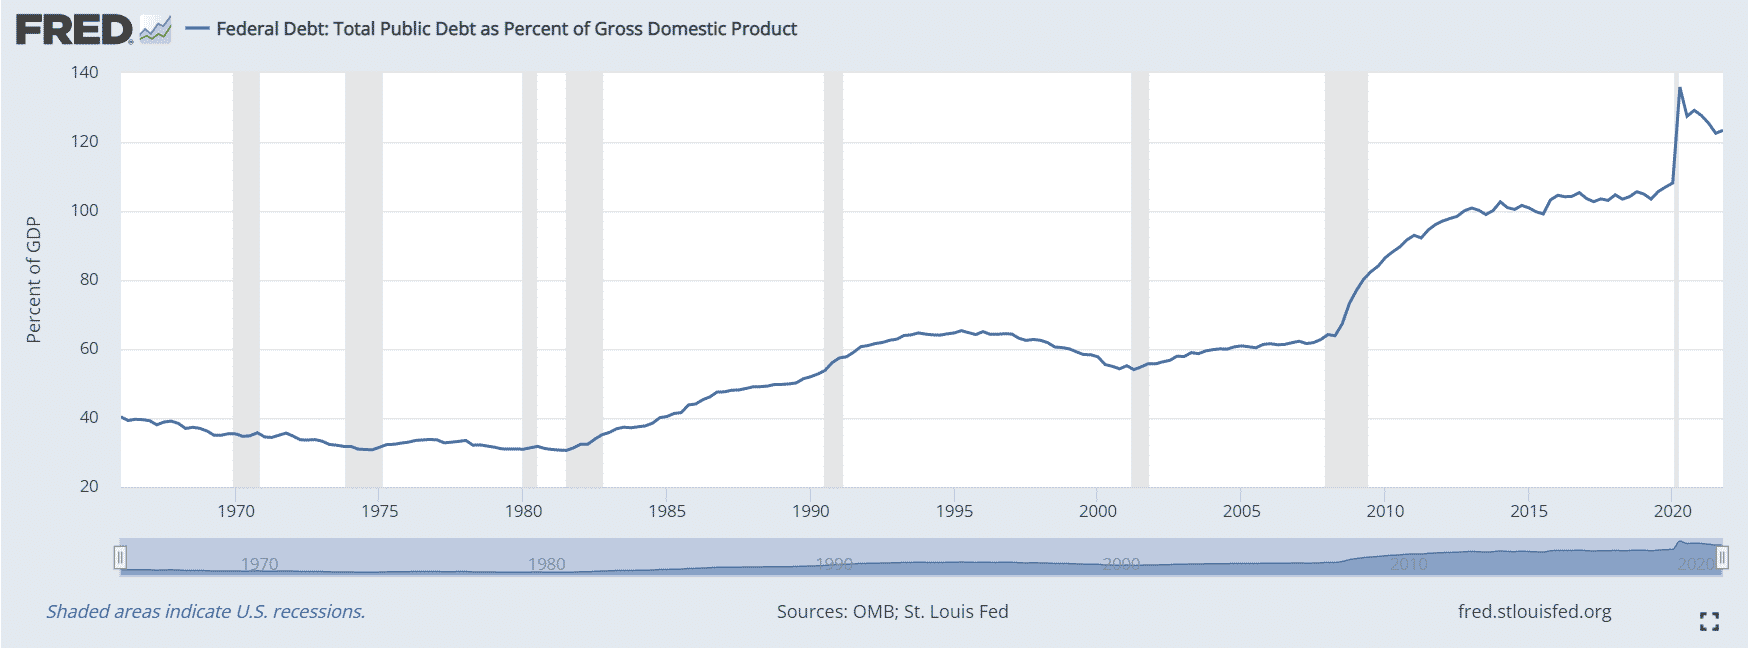
Having a high inflation rate—at least for nations like the United States where debt is denominated in the national currency—is slow-motion repudiation of that debt. If the inflation rate is 10 percent, and the national debt is $30 trillion, the inflation rate is basically like telling debtors that Uncle Sam won’t pay back $3 trillion of the debt every year. In essence, as long as inflation is 10 percent or more, the federal government could in theory run a $3 trillion annual budget deficit forever and never increase the proportionate burden of the national debt, as measured in percentage of GDP (so long as GDP doesn’t decrease in a depression).
Indeed, the history of the 1970s was one where the federal government ran perpetual annual budget deficits and the federal debt-to-GDP ratio fell reliably.
The problem with running inflation and deficits over the long term is that the federal government’s parlor trick catches up to them. Bond-buyers who expect inflation demand a higher interest rate or inflation-indexed bonds, which increases the burden going forward. It wasn’t that long ago that the federal government was paying 13 percent (or more) interest on 30-year bonds following the 1970s-80s era inflation.
In a sense, the cost of the Federal Reserve Bank’s inflationary practices have pushed the burden of inflation down the road, just as 1970s monetary inflation did. The burden must be paid, of course, but it won’t be paid in a sudden crash like 2008.
Leisure suits, bell-bottoms, and disco music may not be making a comeback. But Americans will—instead of a sharp shock to the economic system and quick recovery—have to endure a long economic slog just like the late 1970s. More than likely, Americans will begin re-acquainting themselves with the term “stagflation” and endure frequent, moderate recessions until a few years after the dollar’s course is righted.