So the talking heads of bubblevision think inflation is abating, but what about this: Federal revenues in November posted at $252 billion—10.3% below last November—while spending came in at $501 billion. And the latter included an ominous +53% rise in Federal debt service costs compared to a year ago.
That’s right. After two-and-one-half years of so-called “recovery” from the Lockdown Recession of Q2 2020 and unprecedented monetary and fiscal stimulus, Uncle Sam’s November receipts barely amounted to 50% of Washington’s half trillion dollar eruption of Federal largesse, free stuff, pork and war-making.
In exactly what universe, therefore, is that not inflationary?
Indeed, last time we checked it was supposed to be banana republics which spend at 2X their level of revenues, not the leader of the so-called free world.
As a technical matter, of course, U.S. Treasury borrowing per se—even November’s record of $249 billion in a single month—is not “inflationary” if it is financed honestly in the bond pits rather than at the Fed’s printing press.
Then again, there is no free lunch, either. So honest deficit finance has its own downside—the crowding out of productive private sector investment, thereby undermining productivity and the rate of long-term economic growth. That is, more inflationary pressure from the supply-side in a demand-saturated economy owing to two-years of unprecedented stimmies.
For the moment anyway the Fed intends that Washington’s gigantic deficits be financed via the bond pits. But honest public finance will be doubly difficult under current circumstances because in its belated battle against inflation, the central bank has pivoted from $120 billion per month of QE (quantitative easing) to $95 billion per month of QT (quantitative tightening).
That is, where it was pumping massive amounts of fiat credit snatched from thin digital air into the markets via QE, it is now effectively draining cash from the private savings pool at an unprecedented rate.
Obviously, therefore, that’s where the brown stuff will hit the fan. The U.S. Treasury’s current deficit estimate for FY 2023 is $1.3 trillion, and that assumes the economy remains recession-free through September 2023. So insert another $500 billion of realism into that deficit number, then add the Fed’s current plan to dump $1.14 trillion of QT on the bond market during FY 2023.
Together these financing requirements amount to a $3 trillion call on available private savings—a figure which amounts to nearly 13% of projected GDP!
Moreover, there is no way for the Fed to reduce the resulting “crowding out” effect of this massive drain on the private savings pool by means of its tried and true trick of monetizing the public debt. To the contrary, Wall Street’s endless expectations of this kind of “pivot” back to easy money—including a 200 basis point cut in interest rates in the second half of 2023—is just flat-out wrong.
That’s because inflation will remain well above the 5-6% zone through next year and beyond, meaning that the Fed will be in no position to restart its printing presses to alleviate supply/demand pressures in the bond market.
So interest rates will not be heading lower anytime soon, but will be climbing relentlessly higher. Accordingly, Federal debt service costs will also continue to soar, meaning that Washington’s budget deficits will become all the more intractable.
That the Fed is paralyzed on the easing front was demonstrated again in this morning’s CPI report for November. It showed that the part of the inflation equation which the Fed can actually influence in the near term—domestic wages and service sector prices—continues to roar ever higher.
On a Y/Y basis, the CPI for services was up by 6.8%, which compares to 4.7% in March and just 3.4% last November. That is to say, services inflation—which accounts for 60% of the weight in the CPI index—has a considerable head of steam. And it is directly responsive to domestic wage gains, which are now running north of 6% when properly measured.
Y/Y Change In CPI Index For Services, 2018 to 2022

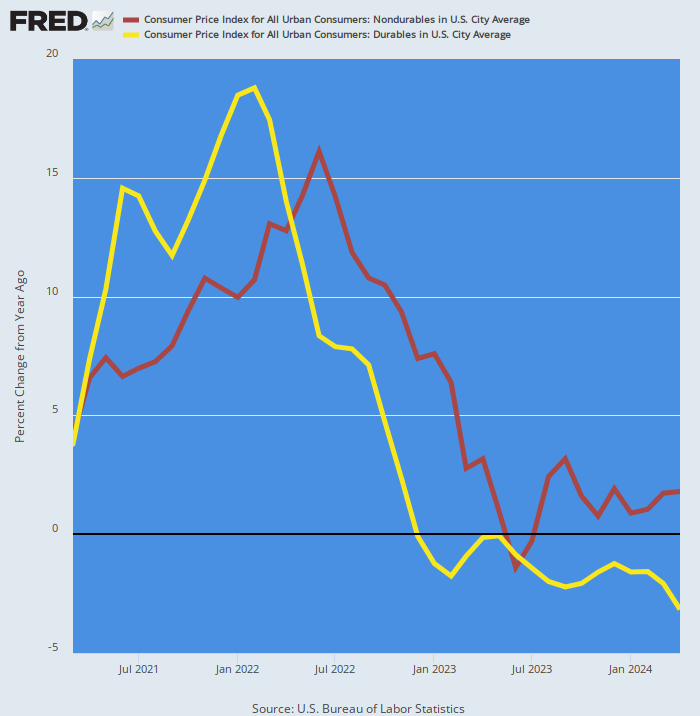
What kept the November CPI’s top line in check at 7.1% Y/Y is displayed in the chart below. To wit, the sub-index for durable goods peaked at +18.7% Y/Y in February and is now down to +2.4% as of November. Likewise, the nondurables sub-index peaked at +16.2% in June and had slipped to 9.3% as of last month.
Here is the thing, however. When you look at the internals in both of these goods indexes it is apparent that they could just as easily rebound higher as continue to move lower. Yet without continuing strong disinflation in the goods sector, wage and services inflation will drive the CPI steadily higher and at rates far above the Fed’s 2.00% target.
Y/Y Change In CPI For Durables And Nondurables, March 2021 to November 2022
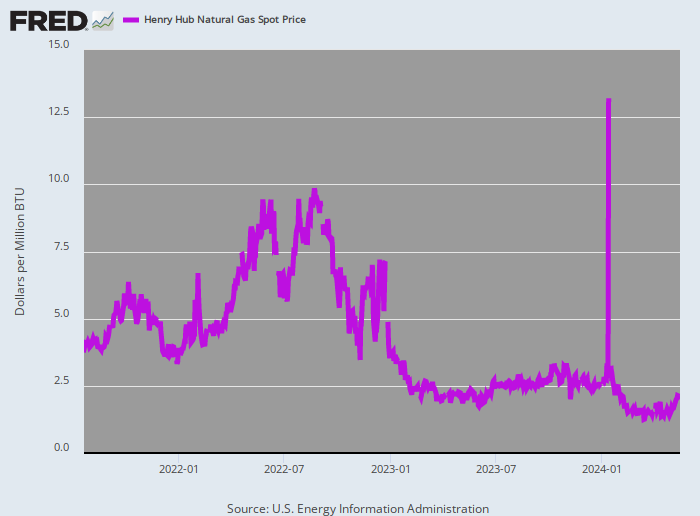
For instance, one of the factors which caused nondurables and energy price to soften sharply in November was a plunge in natural gas prices. Accordingly, the overall energy sub-index dropped at a 19% annualized rate, heavily driven by pipeline utility natural gas which fell at a 42% annualized rate during the month.
But natural gas prices have been exceedingly volatile since last winter when in its wisdom Washington and NATO declared war on the massive volumes of Russian pipeline gas which supplied more than 40% of Europe’s needs, thereby fostering a run on US based LNG as a substitute.
The latter caused the Henry Hub spot price to more than double from $4 per MCF to nearly $10 per MCF at the peak in late August. Thereafter a fire at one of the major US LNG exporting facilities caused a temporary back-up of supplies in the U.S. domestic market and a return of nat gas prices to the $4-5 per MCF range by November.
However, we think that’s all she wrote. The fire-crippled Freeport LNG facility will re-open later this winter, which will sharply tighten the domestic supply/demand balance and likely cause prices to regain some or all of their spring/summer 2022 momentum.
That is, the November CPI benefited from a severe but temporary reversal of natural gas prices, not a permanent reduction in underlying inflationary momentum. And even if prices do not rebound strongly, it sure looks like $4/MCF is a sustainable bottom, thereby precluding another aberrant 42% annualized decline in pipeline gas prices at any time soon.
Henry Hub Natural Gas Spot Prices, July 2021 to November 2022
Likewise, during November motor fuel prices in the CPI dropped at more than a 25% annualized rate, further pulling down the headline CPI figure. But at about $3.25 per gallon gas prices are now back at the pre-Ukraine War levels.
Moreover, the fundamentals of the global petroleum market strongly suggest that gas prices have bottomed. For one thing, the Biden Administration’s foolish tapping of the Strategic Petroleum Reserve, which artificially supplied the world market with 1.0 million barrels per day, has now finished. And there isn’t much left to extend it.
That is, upwards of 200 million barrels are needed in the salt caverns to maintain working pressures compared to the current 387 million barrel reserve level. So there is really less than 200 days of useable supply left at the Biden release rate. And it would be absolute folly to tap that residual—merely to take a few dimes off the pump price of gasoline.
Likewise, the new price cap on Russian oil will likely further curtail global supplies of crude oil, as will the most recent OPEC quota cutback. At the same time, China’s apparent capitulation on Zero COVID will like rekindle demand in the second largest oil consuming economy in the world.
In all, the energy based “stick save” of the CPI in November has little prospect of being repeated month after month in the year ahead.
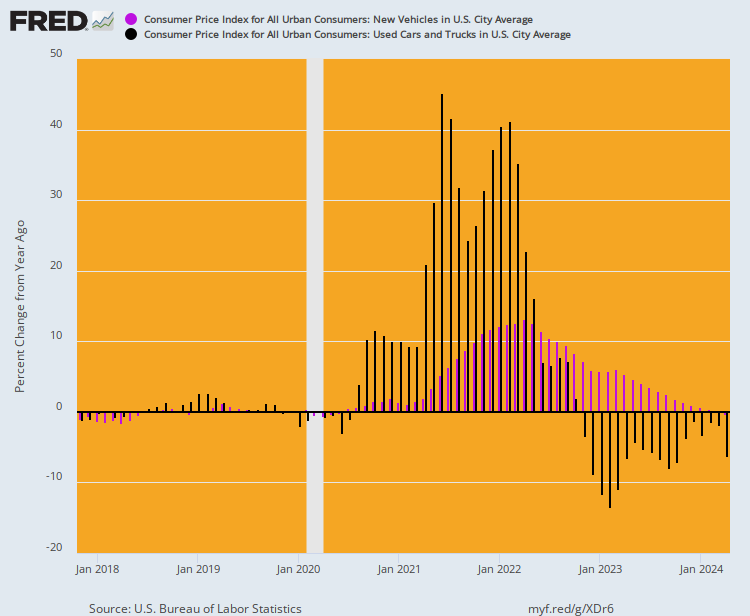
Another big anomaly in the November CPI report was the -35% annualized rate of decline in the index for used cars and trucks. However, the resulting Y/Y decline of -3.3% (black bars) was off-set by a +7.2% Y/Y rise in the price of new cars and trucks (purple bars).
As it happens, used vehicles have a weight of 3.7% in the CPI, while new vehicles are weighted at 4.1%. Accordingly, unless new car prices plunge in the months ahead the overall impact of new and used vehicles on the CPI will be a wash at best.
In fact, the chart makes clear that the one-time surge in used vehicle prices is now behind us and that the off-setting reversal is well underway. Again, these are another example of the violent fluctuations in the economic data caused by the Covid-Lockdowns and the massive stimmies designed to compensate for them.
But all of these effects are temporary and are now in the process of washing out of the numbers. And what lies underneath is a strong headwind of price-wage-cost push inflation that is not going to abate any time soon.
Nor is the Fed’s heavy foot on the brake going to be lifted any time soon, notwithstanding the noise in the November CPI numbers.
That’s a pretty baleful prospect. The cost of financing the massive Federal deficit is soaring, but the Fed can’t do a damn thing about it.
Y/Y Change In New Vehicle Versus Used Vehicle Prices, 2017-2022
This article was originally featured at David Stockman’s Contra Corner and is republished with permission.
