Some big, round-numbered interest rate thresholds have been passed in recent days including 4.0% on the 10-year UST, 5.0% on the 2-year UST and 7.0% on the 30-year mortgage. These all come at the end of extended round trips, of course, so the question at hand is how long did these trips take and what has been accomplished by all of the Fed’s interest rate pegging and repression during the interim.
As to the duration of the round trips, the elapsed time between this week and when rates originally broke lower from current levels are as follows:
Elapsed Time Of Round Trip:
- 10-Year UST: 5,600 days;
- 2-Year UST: 5,700 days;
- 30-Year Fixed Mortgage: 8,090 days.
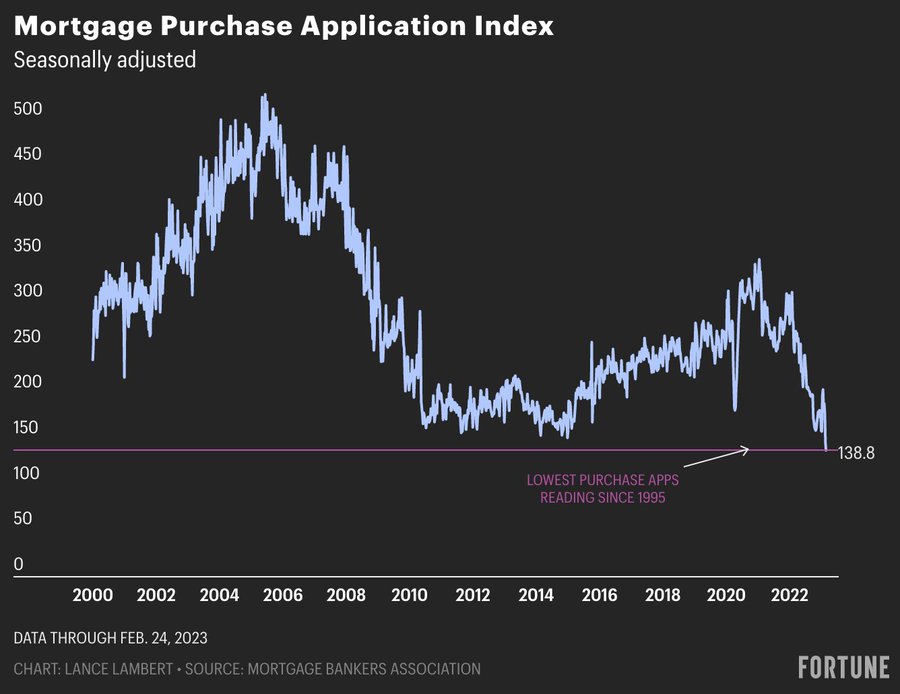
Let’s start with mortgages, where rates on the 30-year first dipped below 7.0% in February 2001 and then fell steadily for nearly two decades to a low of 2.67% in December 2020. After plateauing for more than a year, the mortgage rate has rocketed back to 7.0% during the last 15 months.
The theory, of course, is that the wise men and woman on the FOMC know far better than the free market the appropriate mortgage rate. And also that, especially, the rate path needed to push higher societal investment in housing should not be left to the happenstance of supply and demand.
Alas, we don’t see much evidence that all the massive interest rate repression summarized above did much for real fixed residential housing investment. As of Q4 2022, the figure was still 36% below its 2005 peak and 15% below the level that pertained before Greenspan really poured gasoline on the housing market after the dotcom crash.
As it happened, the housing investment cycle bottomed in Q3 2010 at about 35% below current levels. Given the rate at which new building activity is now sliding, it would not be surprising at all to see real housing investment approach the post-crisis bottom during the year ahead. After all, the seasonally adjusted Mortgage Purchase Application Index is now at its lowest reading of the 21st century. On a year-over-year basis, total purchase applications are down a staggering 43.7%.
Real Private Fixed Residential Investment, 2002 to 2022

When looked at on a longer term basis, the verdict is even more damning. As it happens, the level of private housing unit completions in January 2023 was 1.406 million at an annualized rate. As shown in the yellow line below, that was actually a tad under the level first posted 53 years ago in October 1970!
It would be no understatement, therefore, to say that was truly some kind of round trip to nowhere.
Back then, of course, the US economy was only 25% of its current size in real GDP terms and the number of household units needing homes was 63 million versus 131 million today.
That’s right. We are now at real housing investment levels equivalent to those of a far, far smaller economy.
So the burden of proof sits squarely on the back of Keynesian defenders of monetary policy activism at the Fed. Do they really think that left to its own devices the free market would have generated even fewer housing units and even lower investment than has actually occurred?
We think not. After all, as we show below rampant central bank money pumping does not produce more tangible output or wealth; it simply causes the price of what’s there to steadily inflate.
New Private Housing Units Completed, 1970 to 2023

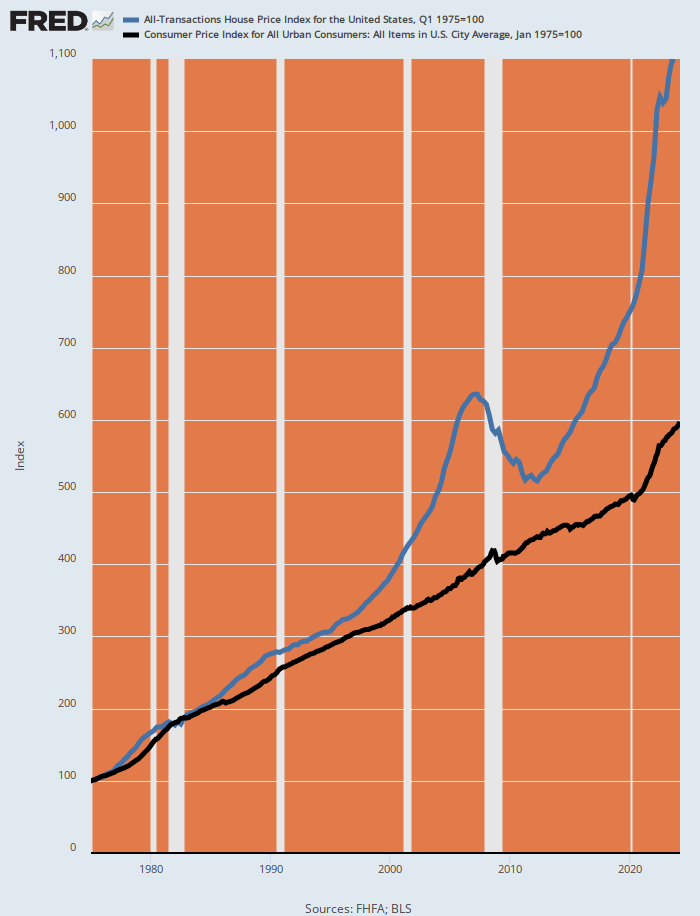
Needless to say, there has been nothing round-trippy and earthbound when it comes to housing prices. In fact, the all-transactions house price index today stands at 1,050X its 1975 level (blue line).
And that’s not just general inflation at work, either. During the same 47-year period the CPI has risen by barely half that amount. So what we have, therefore, is direct evidence that sub-economic interest rates cause supra-economic asset price appreciation in a sector of the economy that is heavily debt financed.
43-Years Of Inflation: House Price Index Versus CPI, 1975 to 2022
Indeed, in more recent years when the Fed went into money-printing hyper-drive, the rate of inflation in the residential housing sector has actually accelerated. For instance, the median listing price of the US inventory of housing units for sale has increased from $127 per square foot in July 2016 to $217 at present.
That’s a gain of 71% in just over six years. And its especially significant because it standardizes to the square foot level to control for the fact that people have been buying slightly “more house” in recent years.
Listing Price Per Square Foot For US Housing Inventory, 2016-2023

Needless to say, Wall Street pays no never mind when it comes to the ways and means of rising prices. Apparently, if it’s higher, it’s better when it comes to asset prices. Full stop.
At least that would appear to be the case with respect to pricing the local condo market. Since 1995 the CPI has doubled, but New York City condo prices stand at 4.05X their early 1995 price level. So money-pumping is well and truly the universal elixir…until it isn’t.
New York City Condo Price Index, 1995-2022

As we have frequently pointed out, ultra-cheap interest rates have not caused real activity to accelerate in the overall main street economy, either. In that respect, the two very best measures of long-term growth are real personal income less transfer payments and the total industrial production index.
Both measures eliminate the inflationary noise in the numbers, of course, but they also remove the distorting effect of today’s massive level of transfer payments. The latter currently totals nearly $4 trillion, meaning that one-seventh of GDP is not new production, but simply wealth transferred from producers to consumers and from future workers to current beneficiaries.
In any event, the sharp growth slow-down since the financial crisis of 2007-2008 is unmistakable. Compared to the longer term trend established during the 41 years between 1959 and 2000, the per annum growth rates since Q4 2007 came in drastically smaller:
- Real Personal Income Less Transfer Payments: 3.51% fell to just 1.80%;
- Total industrial production: 3.40% fell to just 0.04%.
Real Personal Income Less Transfer Payments And Total Industrial Production, 1959-2022

One possible excuse for systematically falsifying asset prices, of course, is that at least it pulls economic activity forward in time, making society wealthier earlier than would be the case on the free market.
But self-evidently, even that canard doesn’t wash. Both residential housing and the main street economy have drastically under-performed their historic growth trends, especially since the pre-crisis peak in Q4 2007.
What we got, instead, was just plain inflation—first in asset prices, now in the prices of goods and services.
So what we get next is a correction—mostly likely a great big, bad one!
This article was originally featured at David Stockman’s Contra Corner and is republished with permission.