Mike Shedlock crystallized the Lockdown Nation catastrophe at hand by focusing on the unemployment claims numbers for Michigan Wednesday morning. And it doesn’t get any more transparent than a staggering 25% of the state’s work force already having filed unemployment insurance claims under the existing Federal/State UI program—only to have its computers crash and burn when the normally uninsured gig workers and self-employed tried to file this week for the new Federal $600 per week Covid benefit:
More than 1 million people — over a quarter of Michigan’s workforce — have filed for unemployment during the COVID-19 pandemic, the state’s top labor official said Monday.
Last week, Michigan reported more than 828,800 unemployment claims filed in the state from March 8 to April 4. Michigan’s pre-coronavirus record for new unemployment claims occurred during the Great Recession in January 2009, when there were 77,000 claims in a week.
In an embarrassing twist Monday morning, Michigan’s unemployment website crashed — again — but this time just as the head of the state labor department was expected to outline how the state would apply benefits for self-employed workers.
Just hours earlier, the unemployment website announced “self-employed workers, gig workers, 1099-independent contractors and low-wage workers can now apply for federal benefits online,” but, when attempting to file, an error message popped up: “This site can’t be reached.”
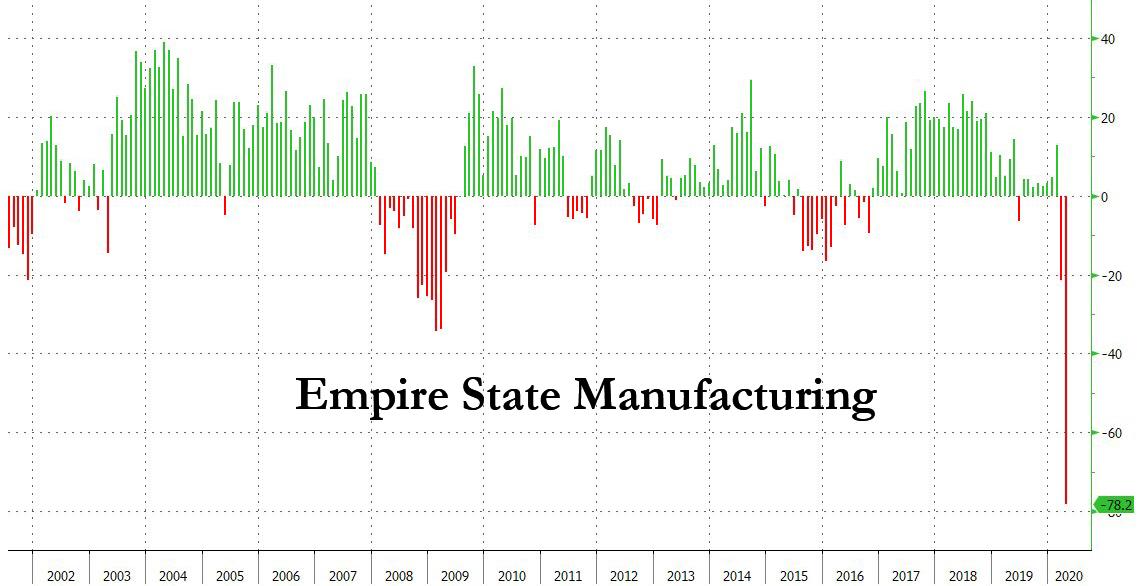
Likewise, the stunning collapse of the Empire State survey this AM left nothing to the imagination. The negative 78 reading for April was orders of magnitude worse than readings during the Great Recession and the post-dotcom crash.
Likewise, the cliff dive embedded in this morning’s report on March retail sales was way off the charts—with the 8.7% m/m drop posting at more than double the worst reading during the Great Recession.
Moreover, March was only a warm-up: The April numbers will be 2X-3X worse.

In fact, when you look at even the March numbers at the product level, the plunge is even more dramatic. Food and beverage and general merchandise sales were actually up smartly owing to the fact the grocery delivery services, Amazon warehouses and home-cooked meals are out of necessity booming.
But when you look at discretionary and Lockdown items sold in the public facility based retail categories the sales crash in March was already in the negative 20-30% range, and, again, the results for April will be far worse.
Even then, March readings like these have never before been recorded on a month/month basis:
- Electronics and appliances:-15.1%;
- Gasoline stations: -17.2%;
- Sporting goods and hobby stores: -23.3%;
- Motor vehicles and parts: -25.6%;
- Food services and drinking places: -26.5%;
- Furniture and home furnishings stores: -26.8%;
- Clothing and accessory stores: 50.5%
Not only are these double digit plunges severe in absolute terms, but relative to history they are literally coming from another economic planet. For instance, the Lockdown of bars and restaurants resulted in a -26.5% m/m change, which compares to the worst ever previously reported figure of -1.5% during the dark economic bottom in February 2009.
We will address the disaster that will ensue from the halting, baby-step “re-opening” of the economy being demanded by the infectious disease lobby and the Dem governors and mayors below. But here’s the point: All the upstream supply chains which deliver food and liquor, consumable supplies and equipment to the restaurant and bar business have never previously suffered a measurable recessionary downturn as shown below. This time, however, they will suffer massive loss of sales owning to the near total shutdown of their customers.

In the case of the 50% plunge in sales at clothing and accessory stores, the cliff-diving numbers are even more fantastic. The chart below is not a rate of change measure. It represents actual sales dollars and means that in a single month, 25 years of sales growth was wiped-out.
Accordingly, the $11.1 billion of sales posted by these retail units for March was the lowest sales level since May 1995—–and these are nominal sales that give no account for the 40% increase in the general price level that has occurred in the interim.

The same story pertains with regards to furniture and home furnishings stores.
During the last 27 years, monthly sales have never dropped more than 5%, but in March sales collapsed by nearly 28%. Within two months, sales from these venues will easily by off by 50% or more for January 2020 levels.

Likewise, auto sales were down by 27.2% in March, and based on current industry information, are likely to be off by 50 to 60% during April.
This magnitude of instant collapse literally has no precedent since the collapse of sales in what was still the infant auto industry during the 1930s. The low point in the Great Recession, for example, was a 10.6% drop in October 2008 while the 15% drop in September of 2009 was a government instigated calendar aberration which occurred when Washington’s cash-for-clunkers boondoggle came to and end.

Needless to say, the collapse of retail sales is rapidly passing through to the production end of the economy—-with the March industrial production numbers published this AM providing merely a hint of the disaster to come later this spring.
Manufacturing output was already down by 6.3% in March, which is more than double the trough decline of 3.5% in December 2008 and the 2.5% drop in at the bottom of the 1982 recession. Again, however, by April and May the plunging bars on the right margin of the chart will be down by 20-30%, at minimum.

Obviously, one reason 25% of the Michigan work force has already applied for unemployment is the auto assembly lines are tanking like they did in the winter of 2008-2009. Then, of course, both Chrysler and GM were already in bankruptcy and the Fed still had a massive trove of dry powder.

So the question recurs. How long can the Lockdown madness continue when it is self-evident that the US economy is going into cardiac arrest?
And They’re Gone! Lockdown Nation Wiped Out 10 Years Of Jobs Recovery In Four Weeks
And they’re gone!
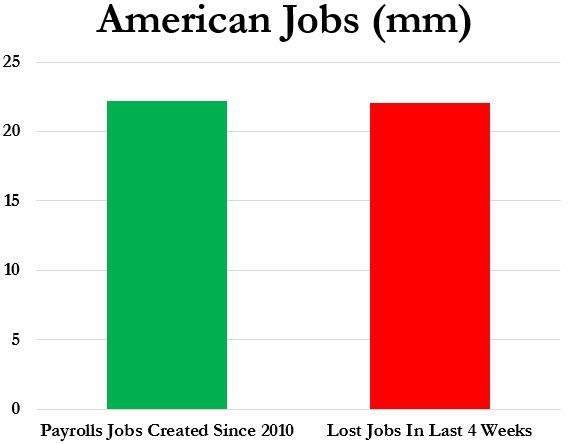
We are referring to the 22 million jobs the BLS says were created since the Great Recession. But with today’s report of 5.2 million new unemployment claims, the four week total now stands at, well, 22 million jobs lost.
So let’s just cut to the chase. There are two death watches underway in America, and the above chart tells you all you need to know.
The morbid, sensationalized CNN/Cuomo Brothers/MSM/infectious disease lobby’s Covid Death Watch has spawned a hysteria among officialdom and much of the broad public that is literally killing economic function and rationality.
For example, the odds of the chart below happening from a normal business cycle downturn or even a so-called exogenous shock like the 1973 oil embargo or the 9/11 national security shock or the worst hurricanes or earthquakes of the last 53 years is virtually nil. The exploding red line on the right margin is government-made and hysteria born.
After all, each the above referenced economic blows, including 7 recessions, did actually happen during the period encompassed by unemployment claims chart below. But relative to the eruption of the last four weeks, they caused nearly invisible squiggles, rounding errors in the last half century of economic history.
Indeed, the 22 million claims over the last four weeks are 10X the size of the worst 4-week period during the Great Recession, and the latter was thought to herald the risk of the 1930s all over again, according to the Bernank himself.

Needless to say, this savage, government-inflicted blow to normal economic life would be one thing if the nation were actually confronted by a deathly Black Plague style pandemic or even an invasion by little green men from Mars.
But no matter how many times the out-of-control politicians, government-funded disease “experts” and the mendacious mavens of the 24/7 cable TV Death March deny it, the Covid-19 is just a highly contagious and somewhat virulent flu that mortally threatens only a very small share of the population — namely, the elderly who already have multiple life threatening diseases and conditions or what are called co-morbidities.
Today’s economy crushing Lockdowns, therefore, are a combination of blunderbuss and a one-size-fits all mantra gone haywire. And it’s happening because the so-called infectious disease experts around the CDC, WHO and Dr. Fauci’s Institute for Allergy and Infectious Diseases gave government officials the utterly wrong answer: To wit, they explained how to 100% stone-cold stop the spread of a virus that in today’s world can’t be stopped and needn’t be.
If politicians had any functioning gray matter between their ears they would have asked this question, instead: When the Covid-19 virus makes its inexorable trip through the population pool, who is most at risk of serious illness or even death, and what are the most efficacious and quickest methods to protect those people who will bear the brunt?
Yes, Covid-19 is a new strain, but its a corona virus variant that epidemiologists and other medical experts know a lot about, having studied SARS, MERS and H1N1 and their variants for the better part of two decades now. Accordingly, had they been asked to do their proper job — recommend how to protect the vulnerable and likely most serious victims — rather than how to extinguish the inextinguishable, they would have based it on the following crystal clear realities about the disease.
To wit, here are the risk-of-death ratios for the Covid epicenter population of New York state. These would not have been a mystery to the experts who have studied these kinds of flu-based viruses, yet among the 12,192 reported corona deaths through April 16, the mortality rates were:
- 0-29 years: 60 deaths and 0.8 per 100,000;
- 30-49 years: 653 deaths and 13 per 100,000;
- 50-69 years: 3585 deaths and 73 per 100,000;
- 70-79 years: 3253 deaths and 258 per 100,000;
- 80 years & over: 4641 deaths and 1,214 per 100,000.
For crying out loud. You do not need to be a PhD epidemiologist or credentialed health policy expert to understand that when the risk of death for octogenarians is 1500X higher than for the under 30 population, then you do not have a one-size-fits all general public health emergency.
What you actually have is a radically skewed adverse response among the elderly to a common virus circulating among the entire population. And it bears fatally almost exclusively upon those who are already suffering from serious and even life threatening illnesses, and who are also overwhelmingly known to the health care system and doctors who are treating them.
Yet for want of doubt, let us repeat that among the 4,641 WITH Coronavirus deaths among those 80 and older reported by New York state, there were more than 9,000 (2 per deceased) cases of the top 10 co-morbidities including:
- Hypertension: 2,809 (61%);
- Diabetes: 1,418 (31%);
- Hperlipidemia: 955 (21%);
- Dementia: 936 (20%);
- Coronary artery disease: 679 (15%)
- Five others: 2,243 (48%)
Nor is this some kind of aberration unique to the New York cases. A nationwide analysis of hospitalized Covid-19 patients for the month of March shows pretty much the same condition of extensive co-morbidities.
As for the under 50 population, even when you average in the slightly higher mortality rate for New York’s 30-49 years population, the total mortality rate for the under 50 population is still just 5.5 per 100,000.
Is that a rounding error and reducible to the absolutely unavoidable risks of human life?
Yes, it is. In fact, it’s just one-seventh of the normal rate for auto fatalities, other accidents and suicides (34 per 100,000) among this demographic, and only 6% of the normal mortality rate (91 per 100,000) due to all causes for this 67% share of the state’s population.
So what Lockdown Cuomo is really doing is putting the 13.05 million under 50 years population under house arrest not for their own good, but, apparently, in order to protect the 382,000 octogenarian population that is bearing the brunt of the serious illness and death or, more broadly, the total 1.64 million population 70 years and older.
Stated differently, this group accounts for 8% of the New York population but has suffered 65% of the deaths WITH Coronavirus reported to date.
Yet it is not evident at all that quarantining the healthy under 50 years population has done anything at all to protect the vulnerable elderly; at this stage the game, the morbidly ill elderly shouldn’t have been, and wouldn’t have been, going to bars, restaurants, hair salons, pet stores and retail emporiums, anyway.
The truth is, America’s across-the-board Lockdown is on its face irrational — especially when there is a far more deft, targeted alternative. To wit, New York data suggests that nearly 75% of the 12,192 deaths reported in the state to date are Medicare beneficiaries.
That’s right. Their names, addresses, social security numbers, Medicare treatment records, attending physicians etc are known to the government — meaning that they could have been systematically traced, contacted, isolated, assisted and treated by the medical care system and health agencies from the get-go.
Indeed, when it comes to practicality and rational trade-offs, the entire Medicare eligible population could have been targeted for assistance, protection and treatment for a tiny fraction of the $3-5 trillion that the fools on Capitol Hill are fixing to pump into the economy to off-set the massive losses of income and cash flow owing to the Lockdowns.
In the case of New York state, for instance, we have the very epicenter of the world’s Corona epicenter in the form of its roughly 3.6 million Medicare beneficiaries. This 1% share of the US population accounts for upwards of 36% of all WITH corona deaths in the US to date.
Would that the virologists, epidemiologists and other government health agencies have pointed Governor Cuomo in the direction of tracing, isolating and aiding Medicare’s medically vulnerable beneficiaries in lieu of savaging the state’s economy, and, ironically, his own state budget.
Needless to say, the old “but for” argument just doesn’t wash. That is, the specious claim that “but for” the Lockdowns the toll of illnesses and deaths would have been far worse.
We’d suggest that Japan proves just the opposite—even though its population is far older than that of New York.
As it happens, Japan has had no sweeping Lockdowns and even Prime Minister Abe’s so-called emergency decrees have been toothless gestures, possibly designed to provide cover for the $1,000 per head helicopter money he wants to pass out to the nation’s entire population in order to revive his sagging political fortunes.
But whatever Mr. Abe’s motivation, the facts could not be more dispositive. Japan’s restaurants, bars, shops, trains and other public venues are still largely open. But to date it has reported just 8,626 infected cases and 178 deaths.
We have often characterized Japan as a dying old age home heading for bankruptcy owing to its insane monetary and fiscal policies. But at the moment it still has a population of 126.5 million, which means that its reported cases amount to just 6.5 per 100,000, and its Covid-19 mortality rate as of April 15 was just 0.14 per 100,000.
That’s right. Sitting cheek-by-jowl with China, it has suffered one-seventh of a death per 100,000 population during the three months since Covid-19 became a thing.
For purposes of comparison, the rates for Locked-Down New York states are in a different planet:
- New York’s reported cases amount to 1,100 per 100,000 population or 169X higher than the rate reported by Japan;
- New York’s total WITH Covid death rate is 63 per 100,000 population or 450X that of Japan.
At the end of the day, the great H.L. Mencken got the essence of the matter right when he observed nearly a century ago that,
“The aim of politics is to keep the populace alarmed by menacing it with an endless series of hobgoblins, all of them imaginary.”
That is to say, the Covid-19 is real but it’s not remotely the kind of deathly pandemic that warrants trashing America’s entire economic and social life.
Recently, the Donald was making noises that are a reminder that even a blind squirrel occasionally finds an acorn:
“WE CANNOT LET THE CURE BE WORSE THAN THE PROBLEM ITSELF.”
So just maybe the Donald will actually come through on the urgent need to “re-open” because at the moment that imperative outweighs everything else.


