As the debate over lifting the lockdowns in the US intensifies, key data points on testing and infections are routinely mischaracterized.
Consider this summary from Chris Wallace on Fox News Sunday on May 3:
As we said, about half the states — more than half the states have started in some way, shape, or form, reopening. But we’ve crunched the numbers, Doctor, and not a single state has met the White House gating guidelines of two weeks of steady decline in new cases.
It’s not just Fox News that is describing the data in this way. Here’s how NBC News reported it on April 28:
As a handful of states begin to ease stay-at-home restrictions, no state that has opted to reopen has come close to the federally recommended decline in cases over a 14-day period…
Some states, such as Colorado and Kentucky, have reported fewer new cases in the past week. But no single state has had a two-week decline in case numbers.
The guidelines being referenced here are the White House’s “Opening Up America Guidelines”. The document offers criteria in three different areas that states should meet before reopening, but the reports above are focused only on the standards related to new cases. These are the official criteria on new infections:
Downward trajectory of documented cases within a 14-day period
OR
Downward trajectory of positive tests as a percent of total tests within a 14-day period (flat or increasing volume of tests)
So what’s going on here? Is it really true that no state in the US is on the down-slope of the COVID-19 crisis?
No, it’s not.
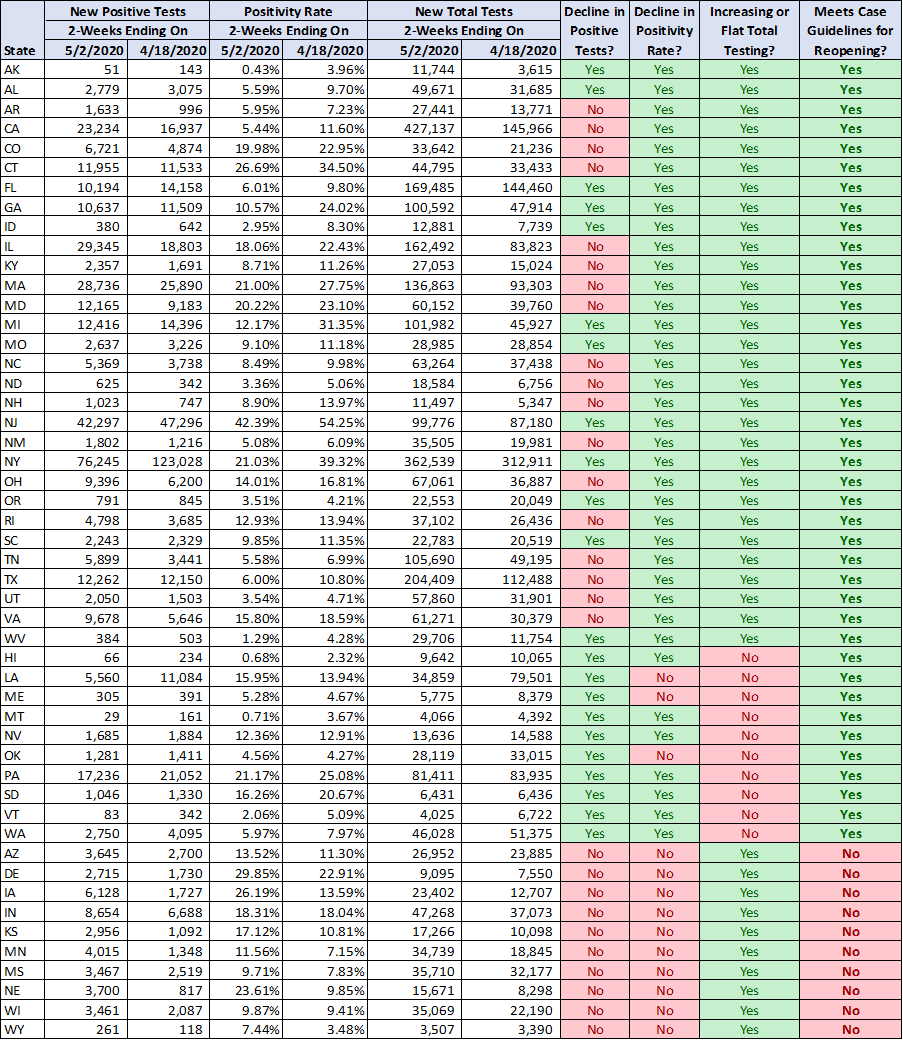
In fact, a quick analysis of publicly available data shows that a full 40 states met one of the suggested criterion on new cases as of May 2. (Specifically, 22 meet the documented cases criterion and 37 states fit the alternative positive test percentage criterion.)
The disconnect arises because the White House guidelines don’t directly spell out the calculation they have in mind when they ask for a “downward trajectory” within a 14-day period. Instead, different people apply their own calculation and reach different conclusions about the exact same data and exact same guidelines.
Worse still, the media outlets cited above are choosing to interpret the guidelines in a way that will be very difficult for any state to meet prior to outright eradication of COVID-19.
As Chris Wallace says in the quote, no state has had a steady decline in new cases over a two week period. If we assume a “steady decline” would require that a state report fewer (or flat) new cases every day compared to the prior day, then this is technically true. But it’s also a really bad standard to use when dealing with data that is expected to have natural variation from day-to-day.
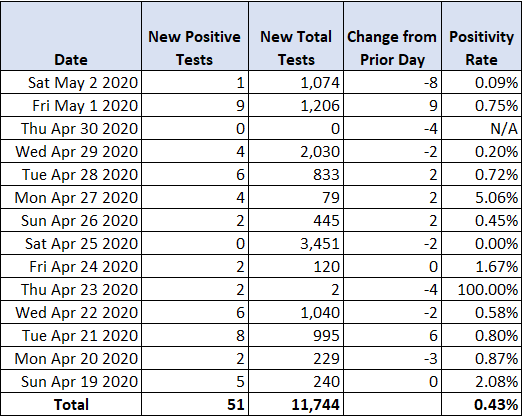
To see how this fails in practice, consider the state of Alaska. As of May 2, this is what Alaska’s last 14 days of test results looked like, using data from the COVID Tracking Project:
In total, Alaska had 51 new cases over the two-week period that ended on May 2 out of nearly 12,000 people tested, for a positivity rate of under 0.5%. Even accounting for Alaska’s smaller population, this data strongly suggests that Alaska has the virus reasonably under control. (For comparison, New Jersey’s stats over this same period was around 42,000 new positive cases and a 42% positivity rate.)
That said, under the “steady decline” standard used by Fox (and NBC*), it would still fail. May 1 saw cases jump from 0 to 9, and broke a 2-day streak of declines. As it happens, the previous day with 0 positive cases also had 0 total tests, highlighting the extreme volatility in daily testing data at a state level. These types of wild fluctuations in daily test counts mean that any daily calculation is bound to be unreliable.
Alaska’s data also shows us why this standard requires almost complete eradication before it can be met. During this period, Alaska had one day (April 25) with 0 positive test results in spite of many new tests being run. Thus, if they were to report even 1 new case in the next 13 days, it would still fail to meet the extreme “steady decline” standard. Clearly, this is not a reasonable requirement and is also not the intent behind the reopening guidelines.
The more appropriate way to do this calculation is to compare the total results from two sequential two-week periods against each other. This prevents volatility in any single day from distorting the result, and provides a much better picture of the trend. Here’s what the results look like for Alaska under those conditions:
In this view, we can see that, while Alaska never experienced much of a spike, its cases do appear to be on the decline. Despite tripling the number of new tests, they still reported fewer cases. The positivity rate shows a precipitous drop accordingly.
Stepping back from the details of Alaska, we can see this same trend play out across numerous other states. The table below shows the key data points for all states for the last two sequential two-week periods using the approach I discussed above. It also identifies which states would currently meet the case component of the White House reopening guidelines based on those results:
Of course, none of this means that the White House reopening guidelines are a good standard, nor that the lockdown policies are even desirable in the first place.
But, if journalists and public officials are going to treat these guidelines as a reasonable standard for phasing out the lockdowns, it’s important to get the math right.
*Note: The NBC article cited above includes a correction indicating that they misstated the guidelines as requiring daily declines. But even though they changed some of the wording in their article, they apparently didn’t rerun the analysis and still concluded no states met the guidelines. That is not true now, and it was not true at the time of their article.


